Posted by Meteorologist Beau Dodson
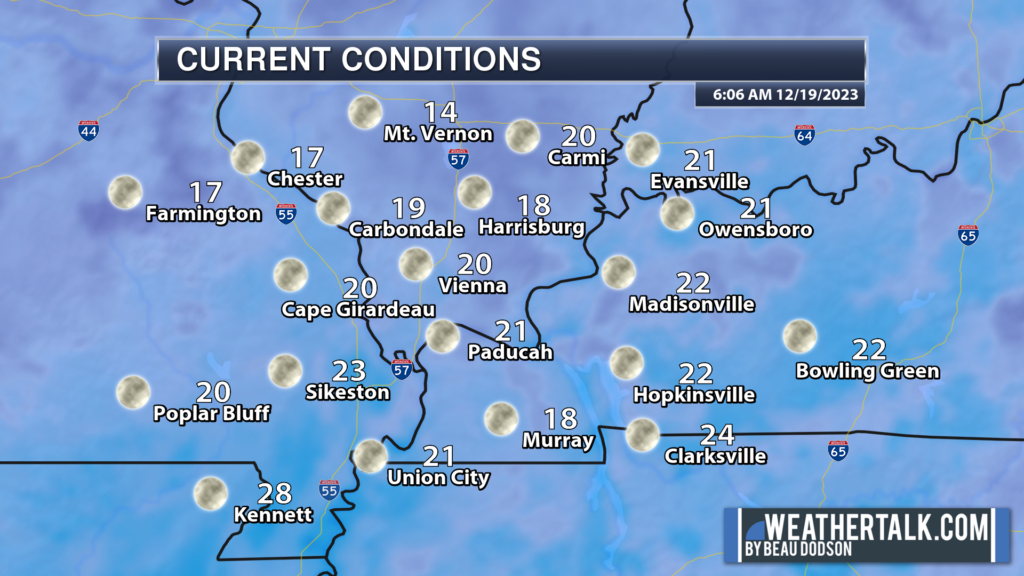
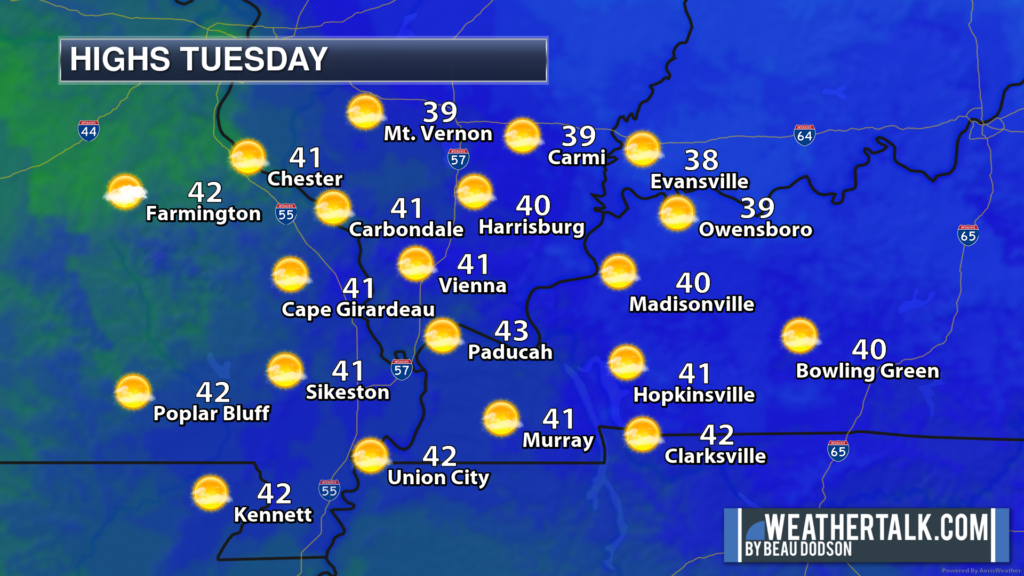
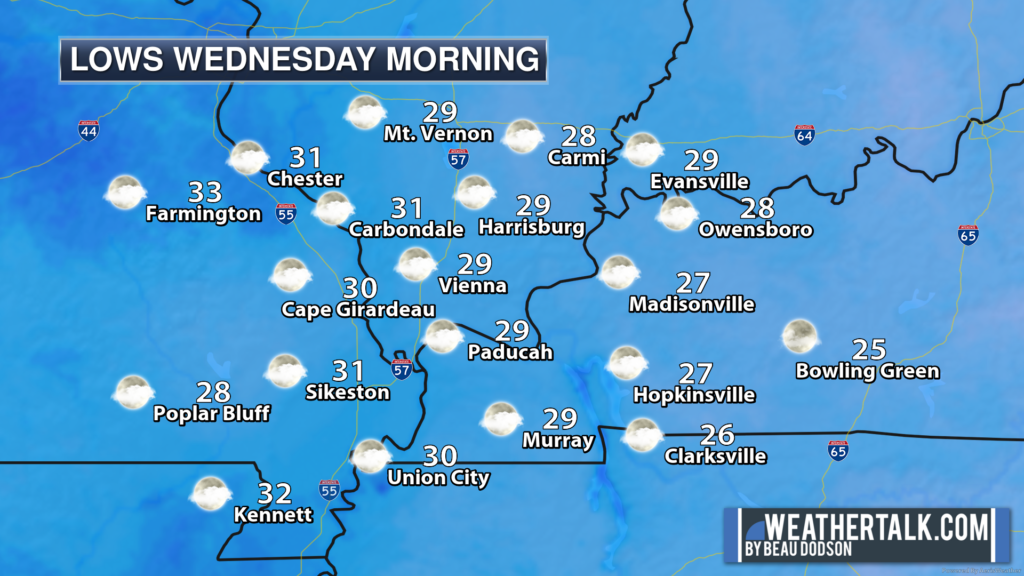
No snow. No ice. But it is bitterly cold across the region. Wind chill temperatures are a few degrees colder than this.
We will have quite a bit of sunshine this morning, as well.
Here is the actual air temperatures, as of 6 am. They could fall another degree or two before sunrise.
Brrrr
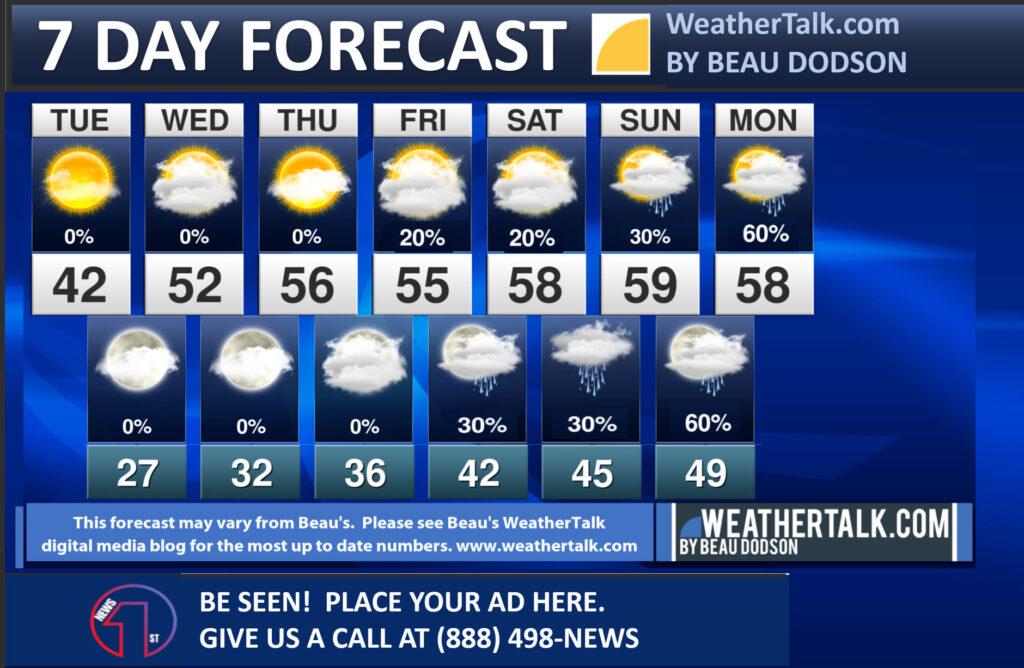
No major weather concerns today or tomorrow. Rain chances begin to ramp up Thursday and that will linger into Christmas with on and off showers.
I continue to watch several systems after Christmas into the first week of January. Whether one of those can deliver snow or wintry precipitation remains questionable. I keep watching.
I will be on WMOK this Friday morning. Be sure and listen in as we will be talking about the rest of winter into spring.
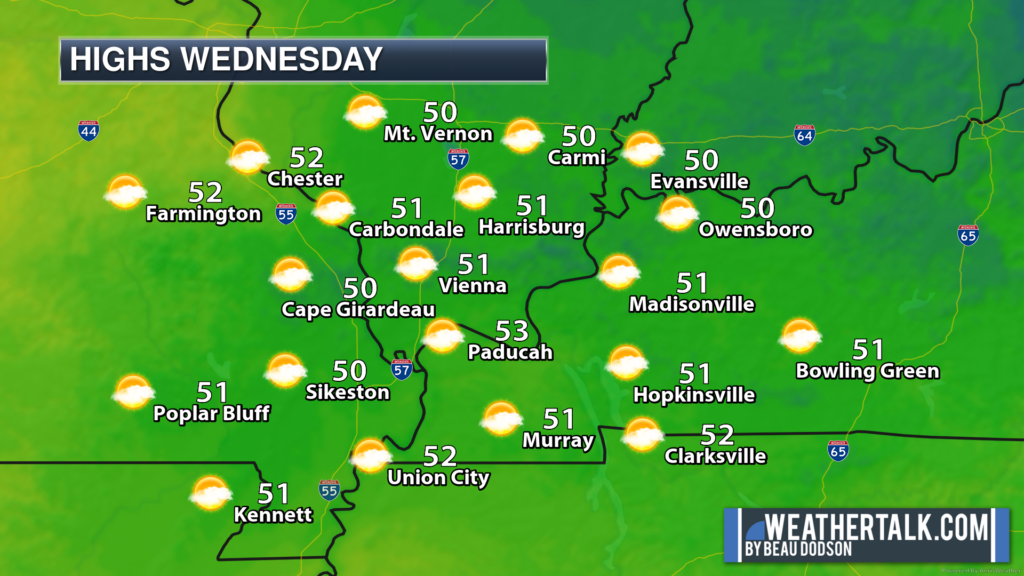
Christmas Eve and Christmas Day are shaping up to be mild. As a matter of fact, upper 50s to near 60 degrees will be possible.
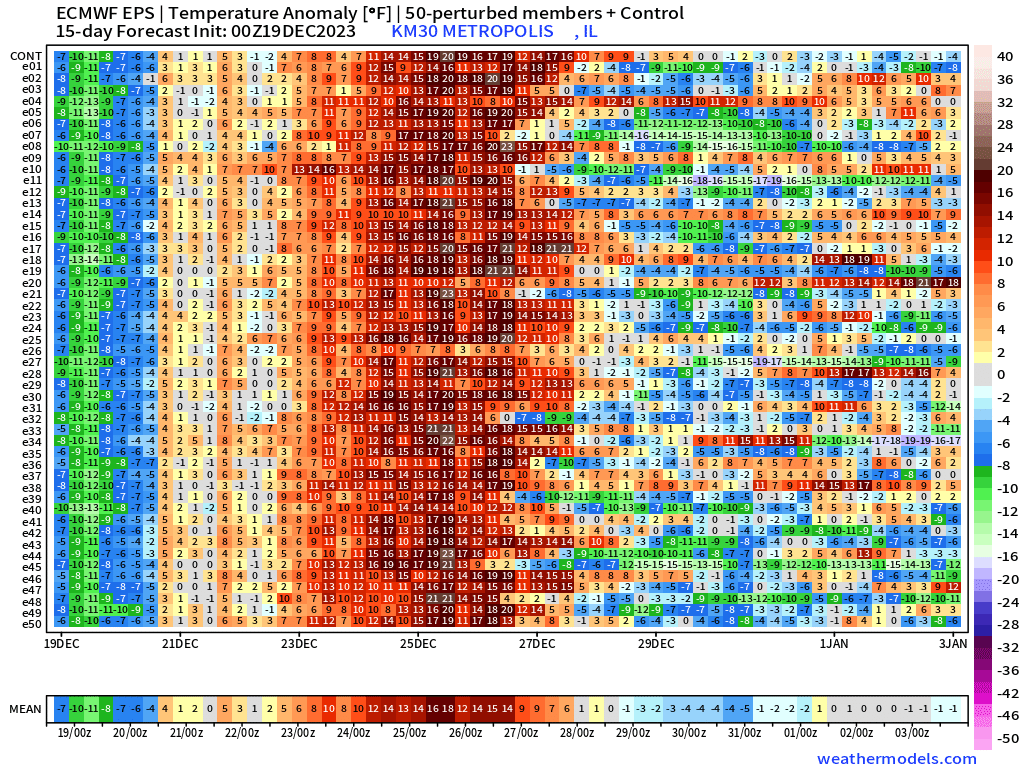
The EC ensembles show that nicely.
The red colors are the warm surge of air December 23rd to December 25th. We then cool down afterwards.
This graphic shows you the temperature anomaly map from today through January 3rd. How many degrees above average will temperatures be? Average highs, for this time of the year, are around 49 degrees. Average lows are around 29 degrees.
The graphic below shows you the EC model. This represents 50 ensembles (ensembles are the same model ran over and over again with slightly different beginning variables). The general idea is that the more numbers that agree, the higher the confidence in the forecast outcome.
The first row is today. Top to bottom. Notice how most of the numbers agree. We will be below average by 5 to 8 degrees. Now, scoot ahead to the 23rd, 24th, and 25th. Those dark red numbers represent temperatures 12 to 20 degrees above seasonal averages.
There is strong agreement that we will have above average temperatures this coming weekend into Christmas Day.
It will also be damp. Showers are likely Thursday night into Christmas. On and off showers. Perhaps even thunderstorms.
Again, we look at the EC ensembles. All that green and blue represents rain totals. You can see a strong clustering of rain totals around the 23rd to the 26th.
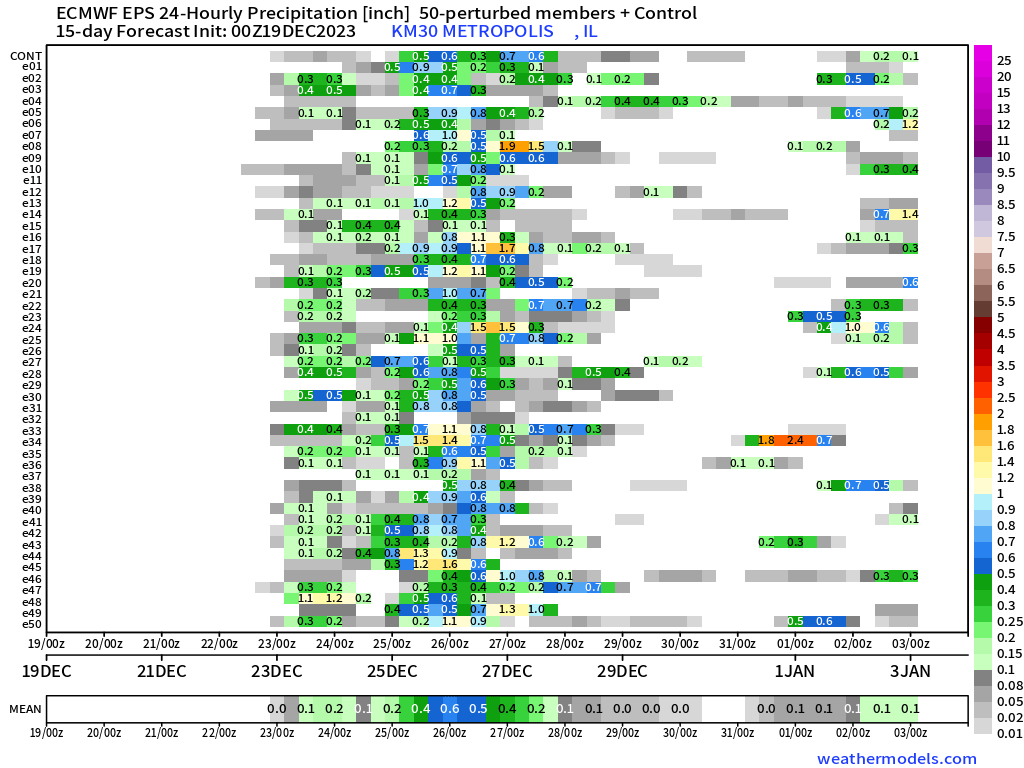
We will have to monitor rain totals. I have not been happy with recent rain events. It seems we forecast more rain than actually falls. Not everywhere, but for many locations.
This could be because of the ongoing drought. Sometimes model data shows too much rain. The dry ground conditions can impact rain totals. That is more common during the summer months vs winter.
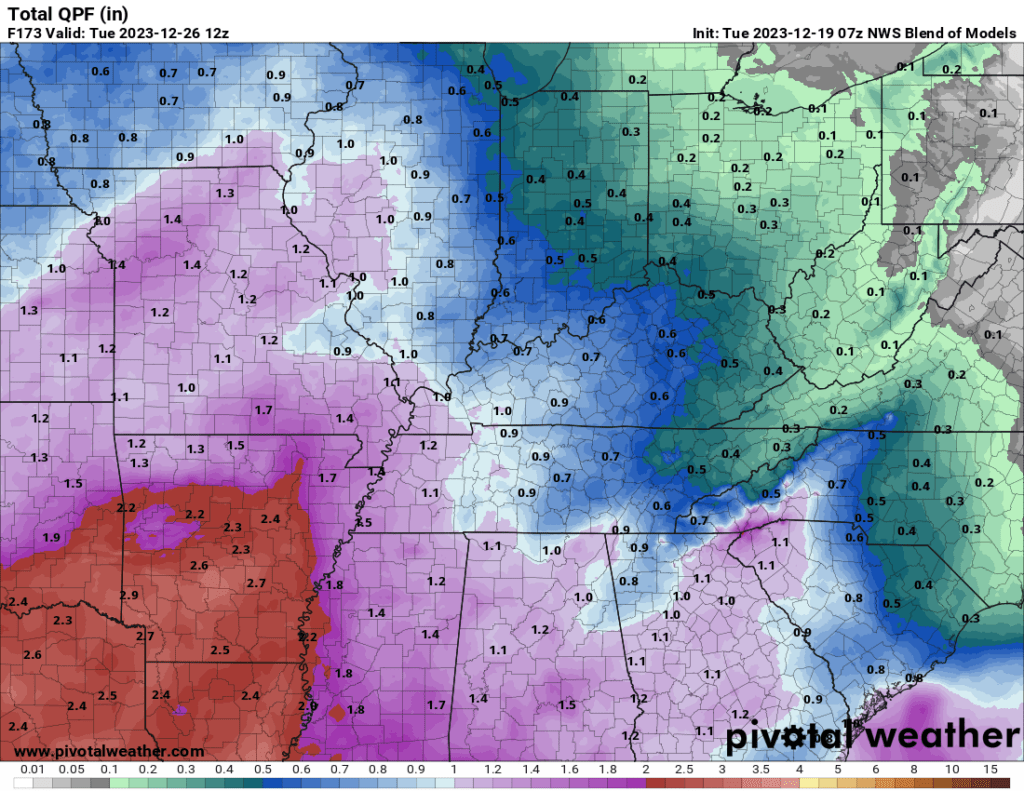
Here is what the NWS Blend of models is showing for seven-day rain totals.
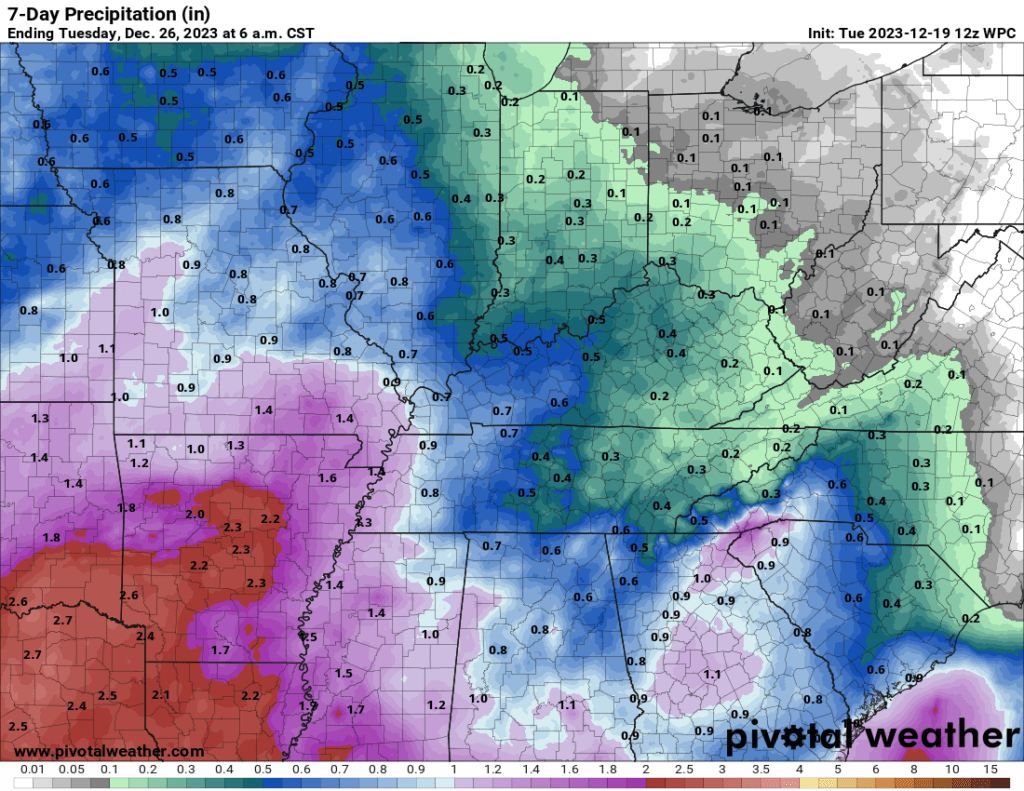
Here is the WPC NOAA rainfall totals forecast. Seven-day totals.
This is what the GFS model is showing for seven-day rainfall totals.
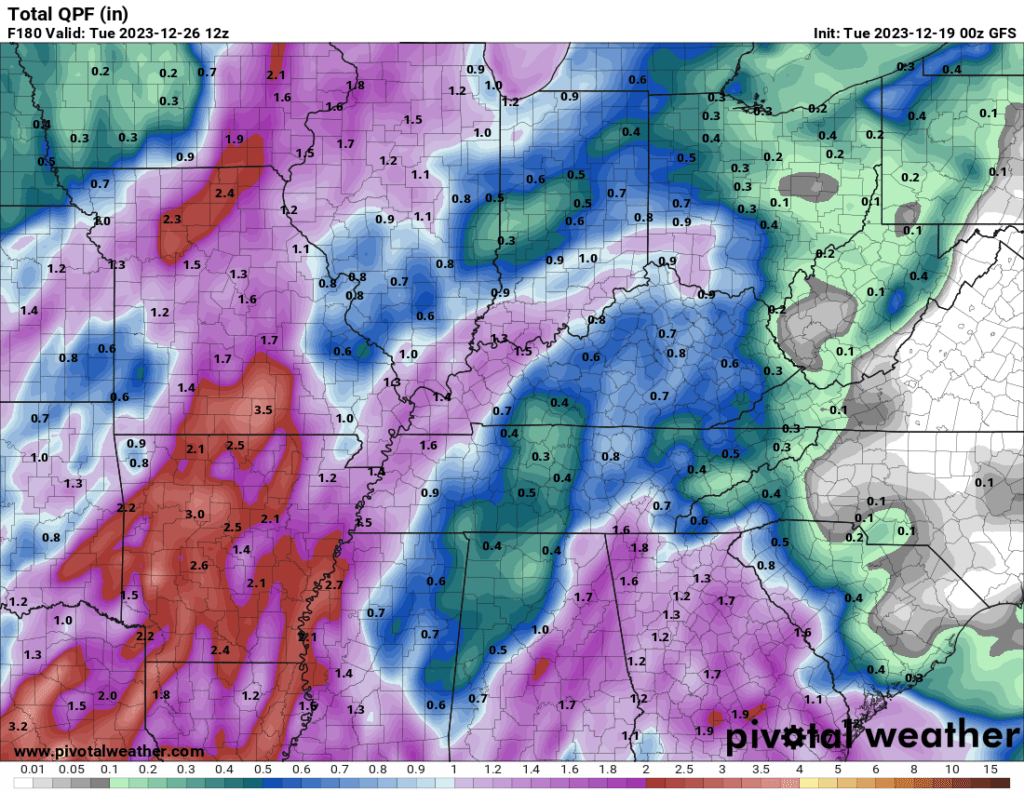
I will monitor trends over the coming days.
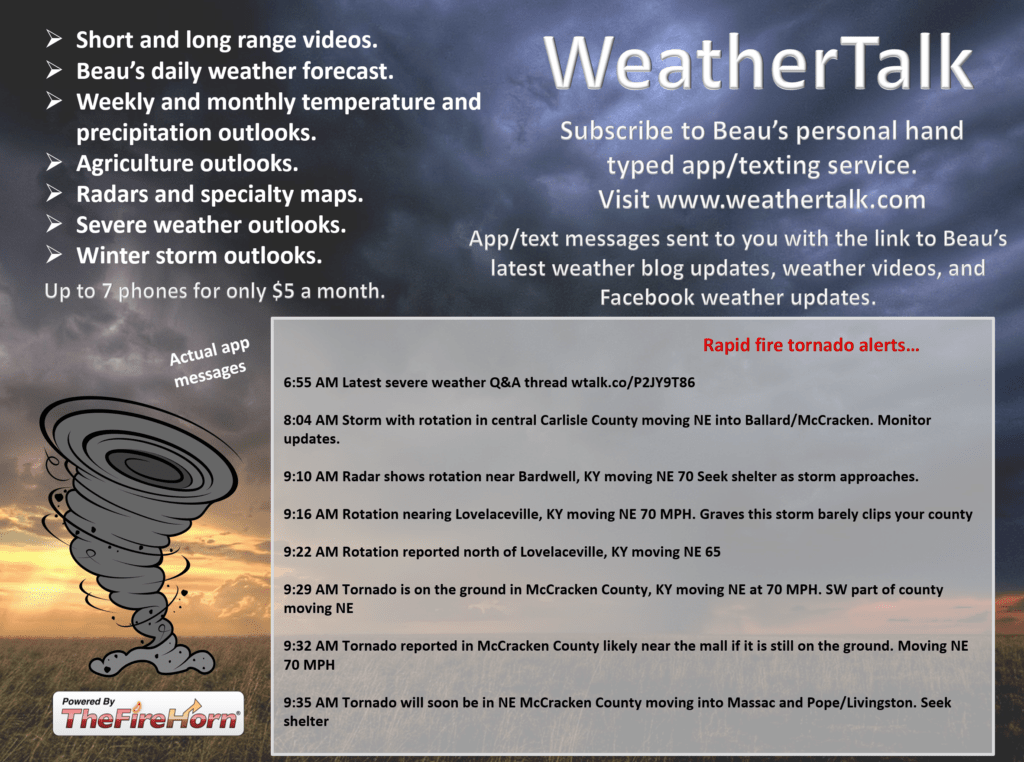
Want to receive more weather information? I provide a service through www.weathertalk.com
Subscribe at www.weathertalk.com and then download the Beau Dodson Weather app from the app stores!
Apple users: Beau Dodson Weather App
https://wtalk.co/9EZYG8A8
Android users: Beau Dodson Weather App
https://wtalk.co/ZEWYU8ME
Need help? Email me at beaudodson@usawx.com
* Daily weather forecasts
* My personal weather blog with all sorts of weather information!
* Special weather statements sent to the Beau Dodson Weather app.
* Rapid fire tornado alerts.
* Severe weather alerts and forecasts.
* Severe weather updates throughout the day (when severe weather is occurring)
* Ice storm alerts and forecasts.
* Winter storm alerts and forecasts.
* Winter storm updates throughout the event.
* Regional weather videos.
* Long range weather videos.
* A daily forecast that I hand type for your county. Sent out every afternoon.
* Long range outlooks. Including week one, two, three, four, and monthly outlooks. Seasonal outlooks.
* App messages to alert you when I have updated the weather blogs and Facebook.
* And more!