The Paducah, Kentucky, NWS has a page of the weather events from 2023. You can view that here – click here. This covers southeast Missouri, southern Illinois, southwest Indiana, and western Kentucky.
PADUCAH, KENTUCKY NWS (NewsFirst) — The year 2023 was very active, particularly through early August. While the region witnessed one of our warmest winters on record, we still managed a couple impactful wintry precipitation events during the last week of January. March roared in like a lion with a powerful storm system that led to severe thunderstorms, tornadoes, flooding, strong gradient winds of 50-70 mph, and the lowest barometric pressure on record in Paducah and Evansville. We witnessed an incredibly high number of windy days during the first several months. Our office ended up issuing a total of 12 wind advisories from January through April (records for wind advisories date back to 2006 and this was 3 more than the previous highest during the first 4 months of the year which was 9 in 2019). During the overnight hours on April 5th, an EF-2 tornado touched down in Bollinger County Missouri and unfortunately took the lives of 5 people as it tore through the town of Glenallen.
An extremely active pattern set up from late June through early August with multiple rounds of severe thunderstorms and flash flooding. The first round arrived over the weekend leading up to the 4th of July, when we issued 154 combined warnings over a 4 day period (breaking the previous 4 day record of 148 warnings set from April 24-27, 2011). This was followed by a historic flash flooding event on July 19th that produced a swath of rainfall amounts of 6 to 11 inches. Numerous Flash Flood Emergencies were issued and the Graves County mesonet site broke the Kentucky state 24-hour precipitation record picking up an incredible 11.28″. Yet another flash flooding event occurred in early August, this time focused slightly further west across southeast Missouri and far west Kentucky. Despite starting off the summer with drought conditions developing from late May through June, parts of the region ended up observing one of our wettest summers on record thanks to the insane rainfall totals from July 1 – August 15. Anomalously high soil moisture levels in August helped contribute to record high humidity levels (dewpoints in the low to mid 80s) which produced heat index readings as high as 120 during our week-long heat wave from August 20-26.
We finally got a much-needed break from the active weather September through November, with drought conditions redeveloping across much of the region. Record low water levels were observed along portions of the Mississippi River from New Madrid down to Memphis in October. As we neared the end of the year, a severe weather event occurred on December 9th across southern portions of west Kentucky. An EF-2 tornado left a path of damage across Todd County, Kentucky (part of a 48-mile-long track which included EF-3 damage in Clarksville, TN). The year ended with a combined 647 warnings (severe thunderstorm, tornado, and flash flood) which was the 2nd most on record for a year dating back to 1995 (the record is 709 warnings issued in 2006).
Read more from the NWS at this link. CLICK HERE
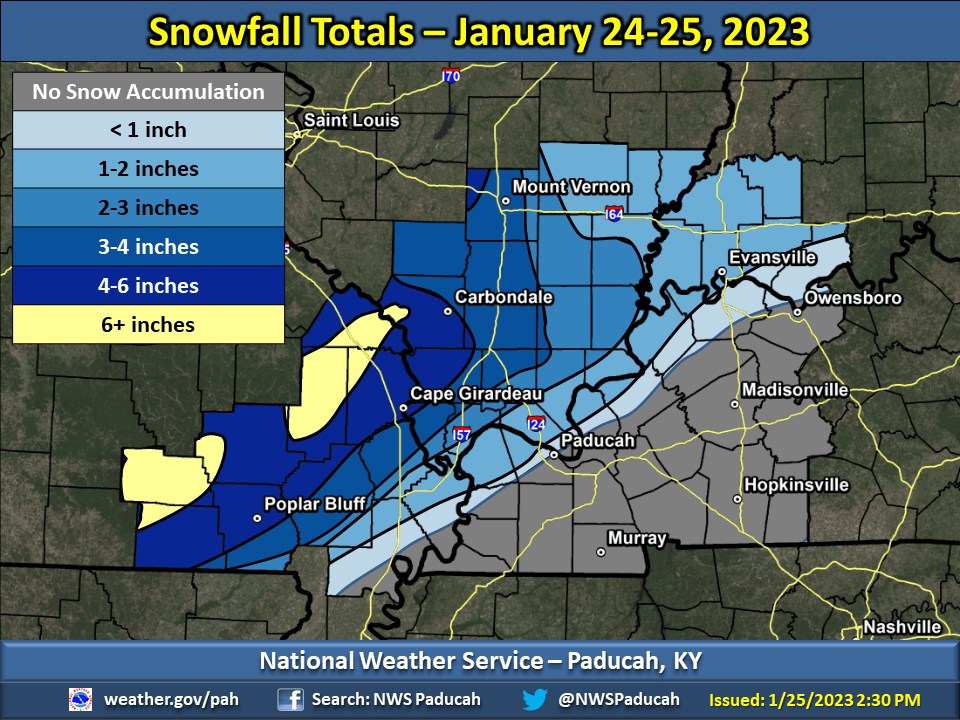
Summary of the January 24-25, 2023, snow event.
A winter storm impacted the region from the evening of January 24th into the morning on January 25th. The bulk of the snow accumulations occurred across southeast Missouri and southern Illinois. These areas remained far enough northwest of a surface low that moved from Memphis, TN to Murray and Owensboro, KY that cold air remained in place once temperatures cooled during the evening of the 24th. Amounts in excess of 3 to 4 inches occurred along and northwest of a line from Poplar Bluff and Cape Girardeau, MO to Marion and Mt Vernon, IL line. Due to the heavy wet nature of the snow combining with wind gusts of 15 to 20 mph, significant power outages occurred across the Ozark Foothills of Southeast Missouri. There were over 75,000 customers without power across south central and southeast Missouri at it’s peak on the morning of January 25th. Numerous downed trees also occurred in these areas. The morning commute was impacted by snow covered roads, especially in areas that received in excess of 2 inches.
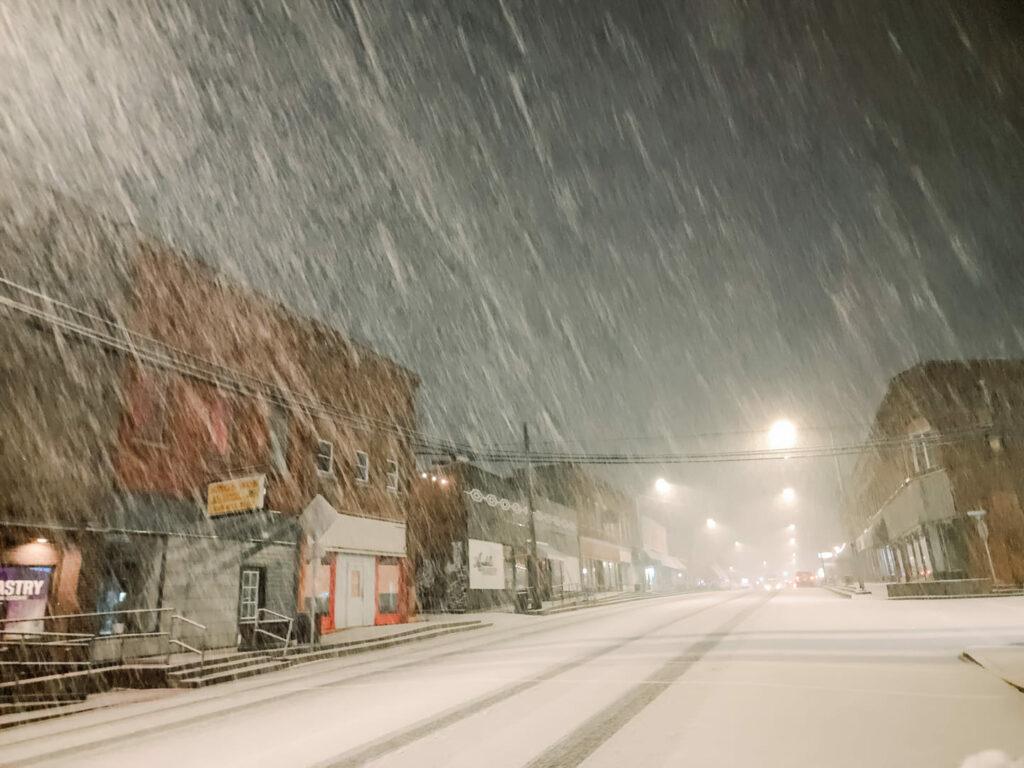
Anna, IL courtesy of Amber Hubbs (above)
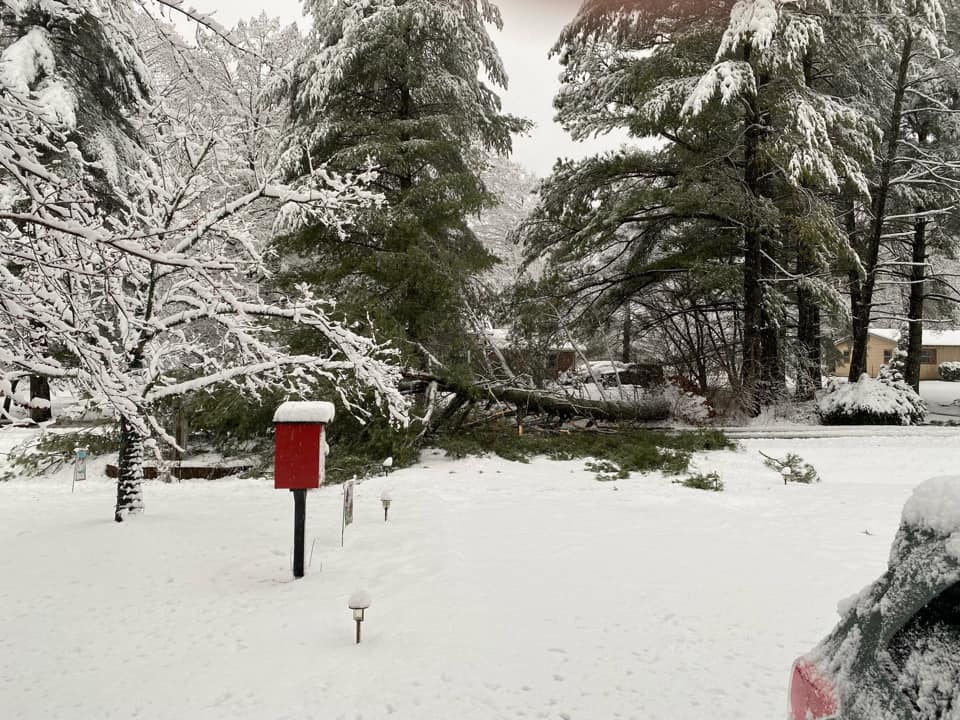
Jackson County IL northwest of Carbondale courtesy of Linda Buhman

Murphysboro, IL courtesy of Cheryl Anderson

Marion, IL courtesy of Cody Simmerman
Summary of the January 30 and 31, 2023 icing event.
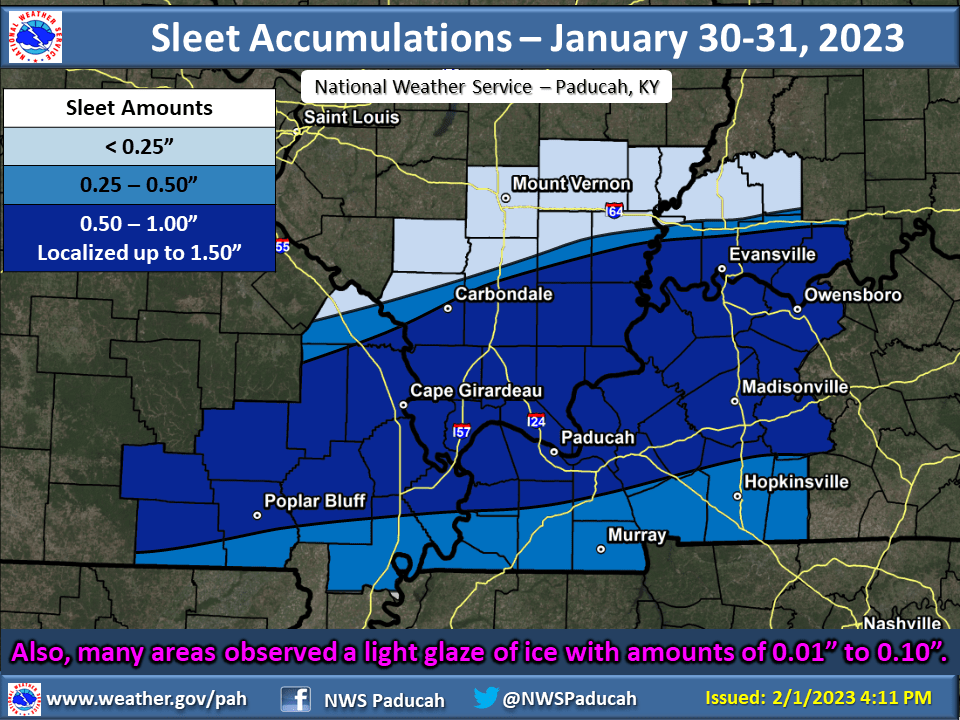
A mixture of sleet and freezing rain impacted the region during the late afternoon and evening on January 30th. The initial round moved out overnight, and then a secondary wave moved in during the afternoon and evening on January 31st. Temperatures were well below freezing so roads quickly became covered with sleet, which compacted down to an icy coating. Even in the days that followed, many secondary roads were ice-covered as temperatures remained below freezing through the morning of February 2nd. There were numerous slide-offs and some accidents. Schools were cancelled in most counties from January 30th through February 2nd. A multi-vehicle pileup on Interstate 24 over the Cumberland River closed the eastbound lanes in parts of Lyon and Livingston Counties on the morning of February 1.
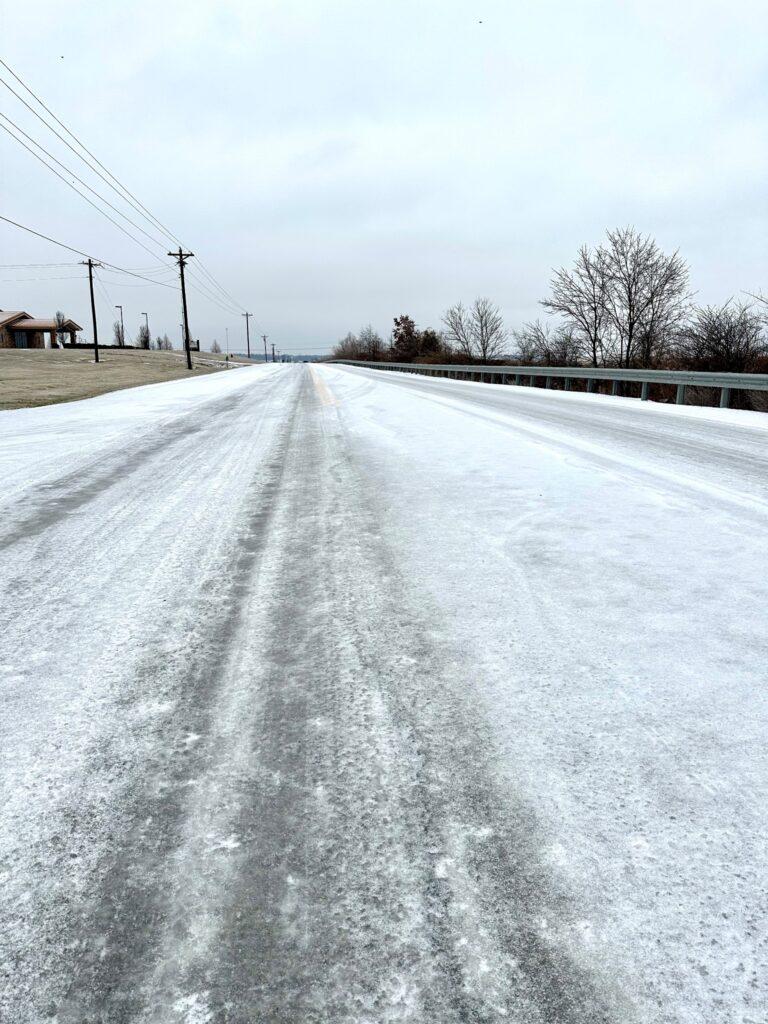
Road in front of NWS Paducah on afternoon of February 1st
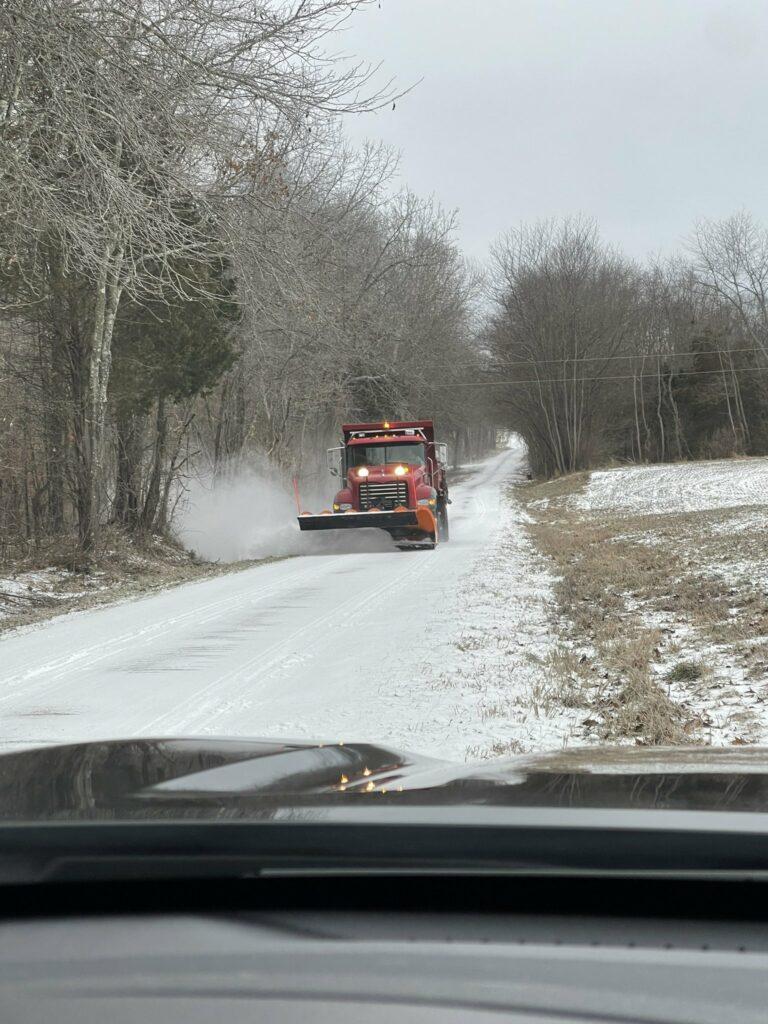
Owensboro, KY courtesy of Daviess County Fiscal Court
Marion, IL courtesy of Cody Simmerman
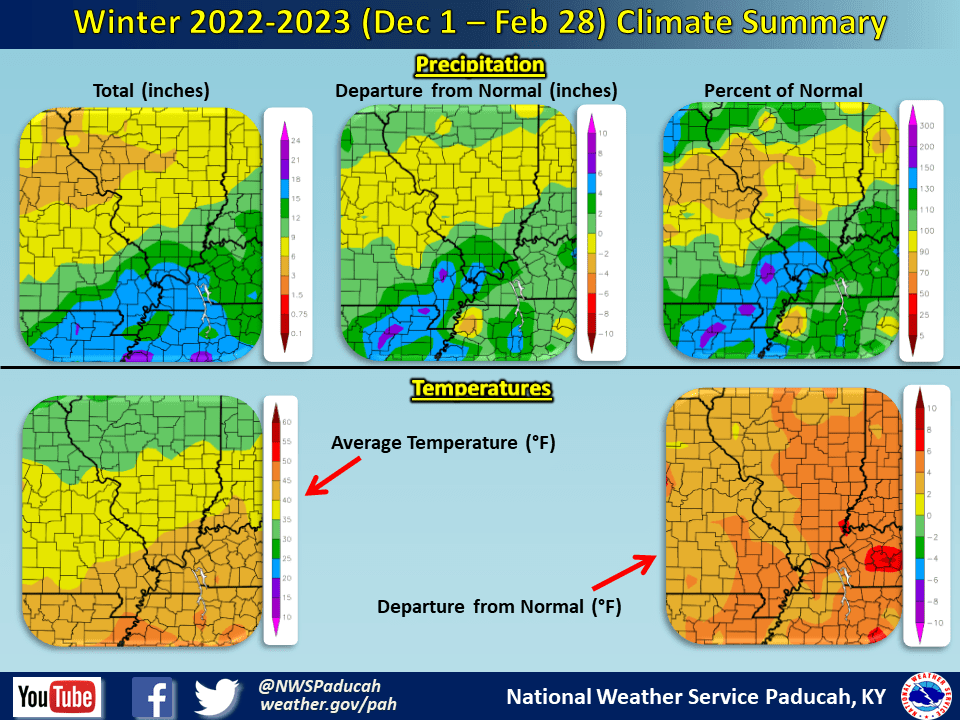
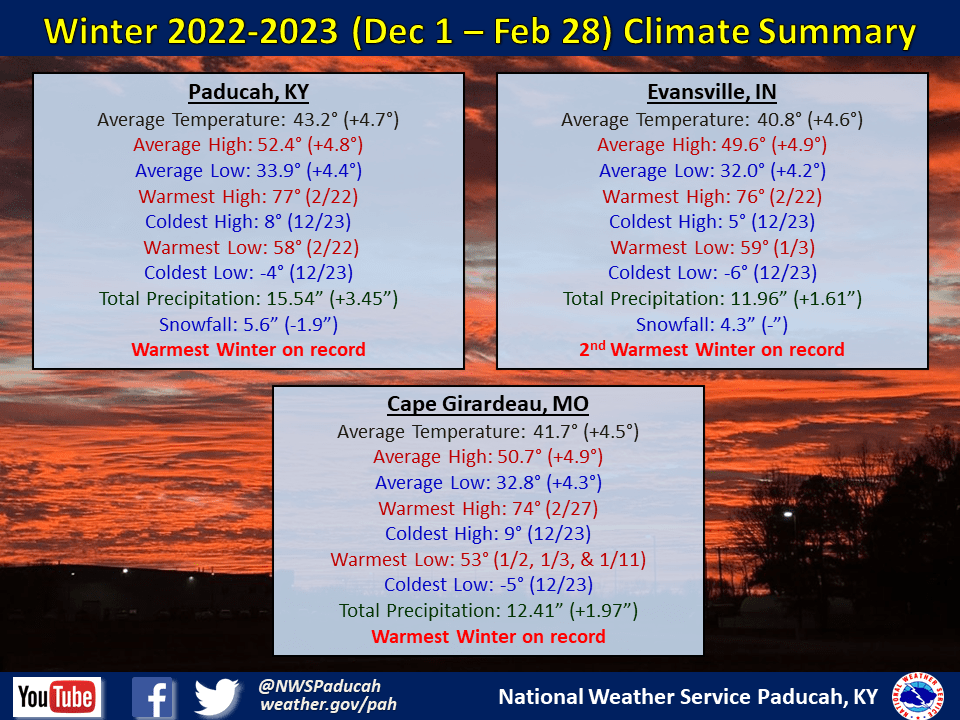
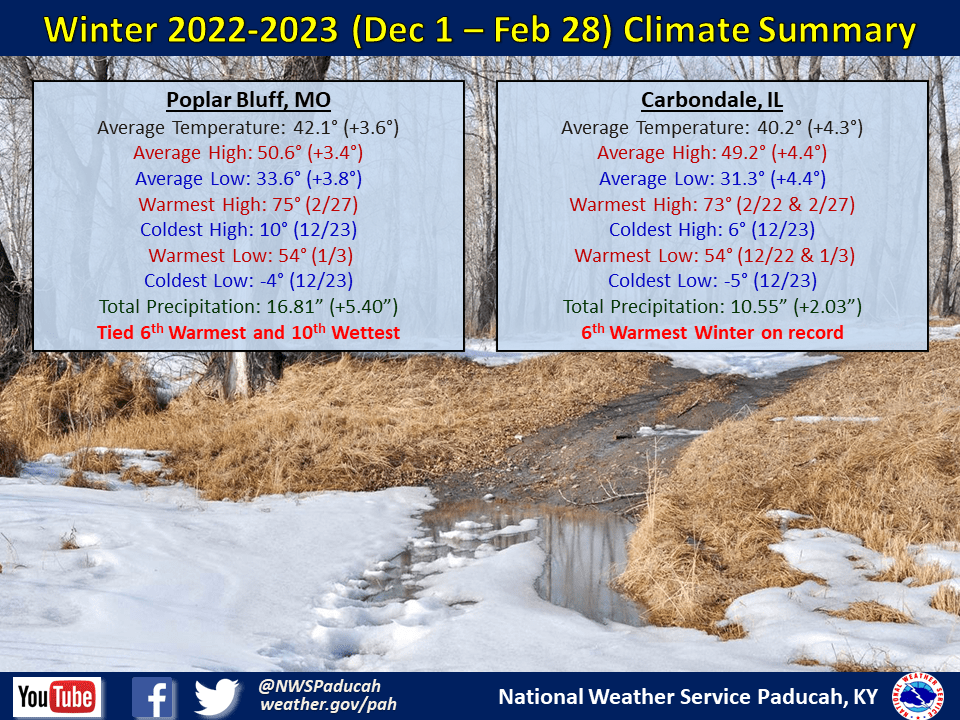
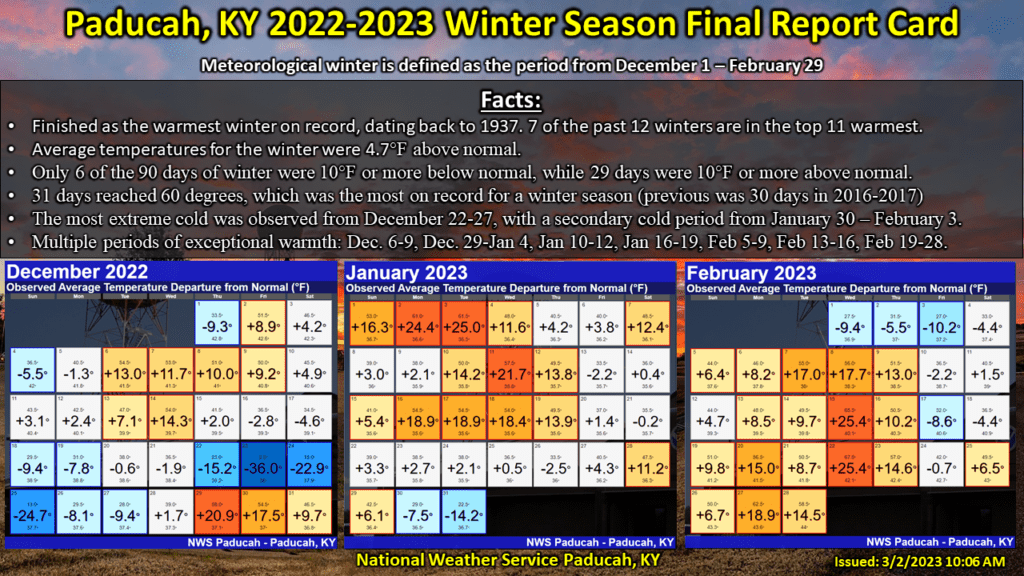
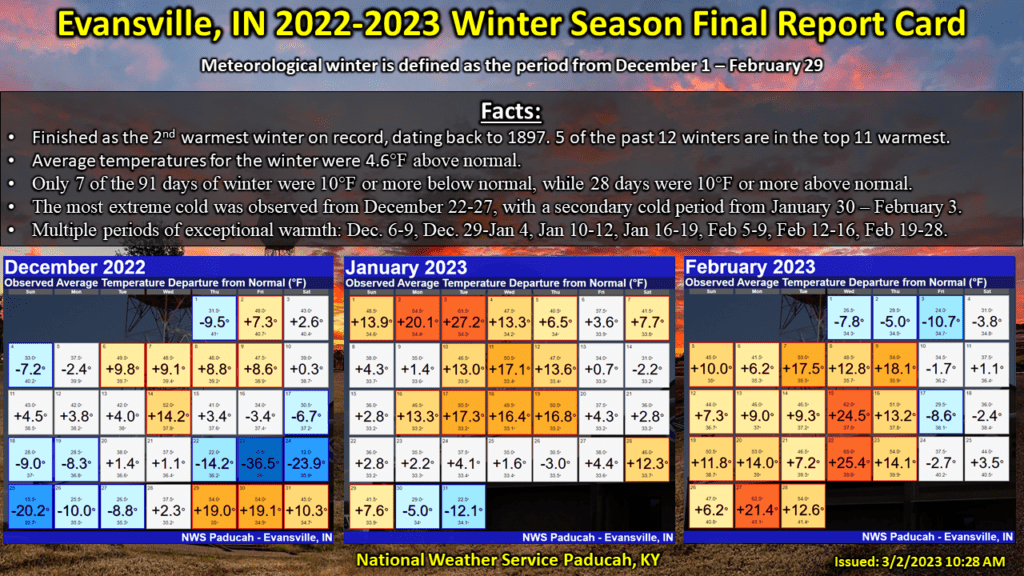
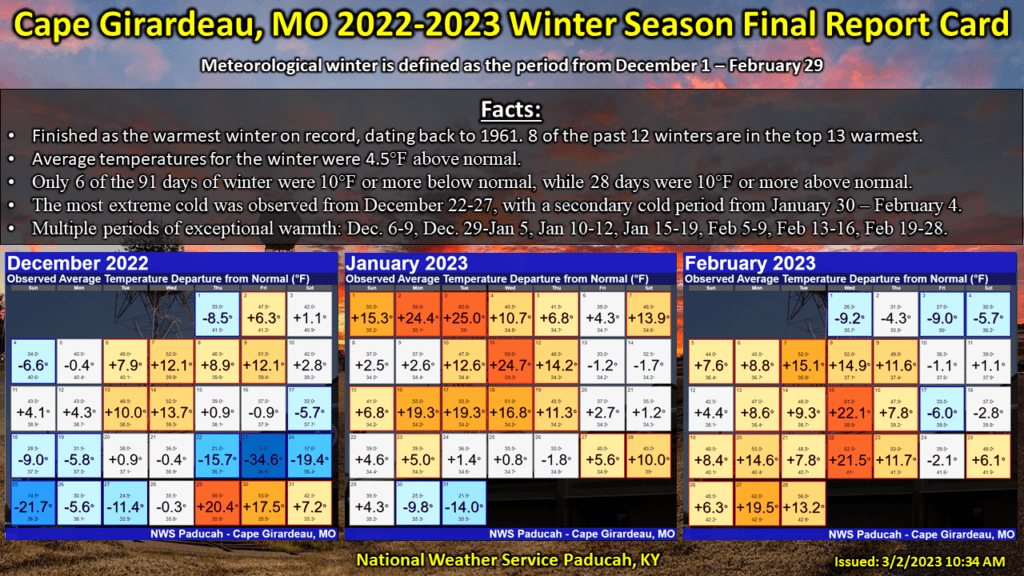
Summary of the December 2022 to February 2023. Warmest winter on record in Paducah and Cape Girardeau.

Temperatures were well above normal by 4 to 5 degrees. It was the warmest winter on record in Paducah and Cape Girardeau. The entire region experienced one of their 10 warmest winters on record. There was one impressive cold air intrusion in the days leading up to Christmas (Dec 22-25). Wind chills of -20 to -30 were observed on December 23, which were the coldest values experienced in our forecast area in over 25 years. This was the only winter in Paducah’s top 15 warmest winters on record that experienced a wind chill reading below -6 degrees (we registered a -21 wind chill on Dec 23). Besides for that brief brutal cold snap, we experienced numerous different periods of exceptional warmth, particularly in January and February. Paducah registered 31 days reaching 60 degrees, which broke the previous winter season record of 30 days set back in 2016-2017. December finished slightly below normal thanks in large part due to the extreme cold around Christmas. Meanwhile, January and February were both well above normal finishing as one of our top 10 warmest on record.
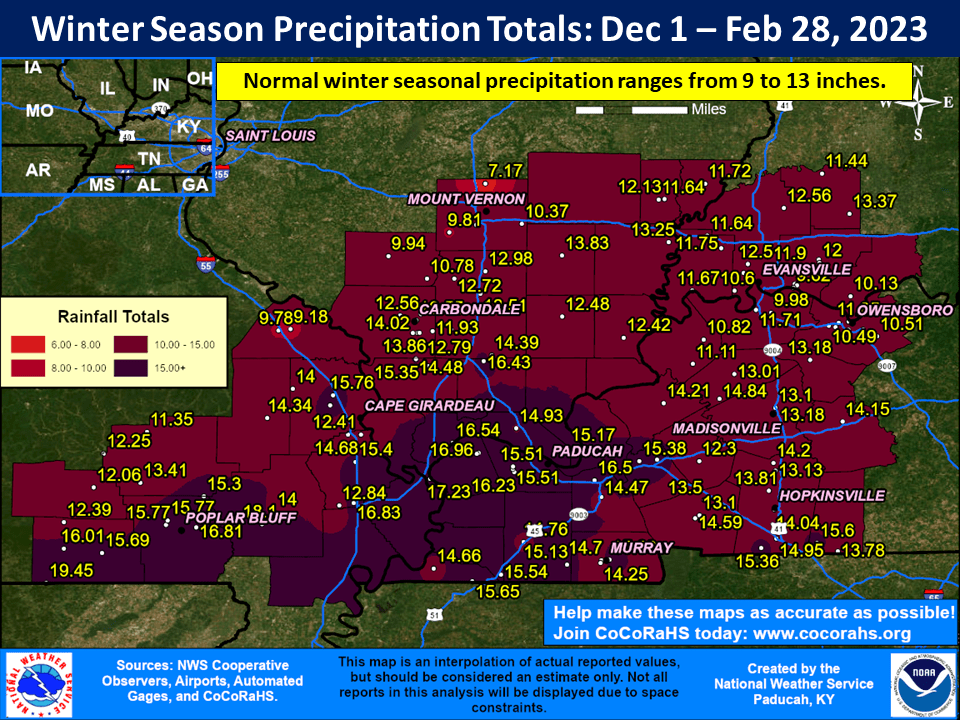
Precipitation averaged wetter than normal across much of the region. Most areas observed between 11 and 18 inches, which was 2 to 6 inches above normal. Southeast Missouri, extreme southern Illinois, and far west Kentucky observed the highest amounts. January was our wettest month compared to normal across a large part of the area. However, December and February were also quite wet in portions of the region. The highest observed amount was 19.45” at a CoCoRaHS station in far southwest Ripley County, Missouri (Gatewood 5.6 SSW).
Snowfall was below normal in many areas. A corridor across southeast Missouri into southwest Illinois received the highest amounts within the area, ranging from 7 to 13 inches. The highest amount was 13.1” at a CoCoRaHS station 1 mile SW of Jackson, MO. A good majority of this snow occurred between 2 events: December 22-23 and January 24-25. A few other winter events were experienced in December and January before snow became non-existent in February.
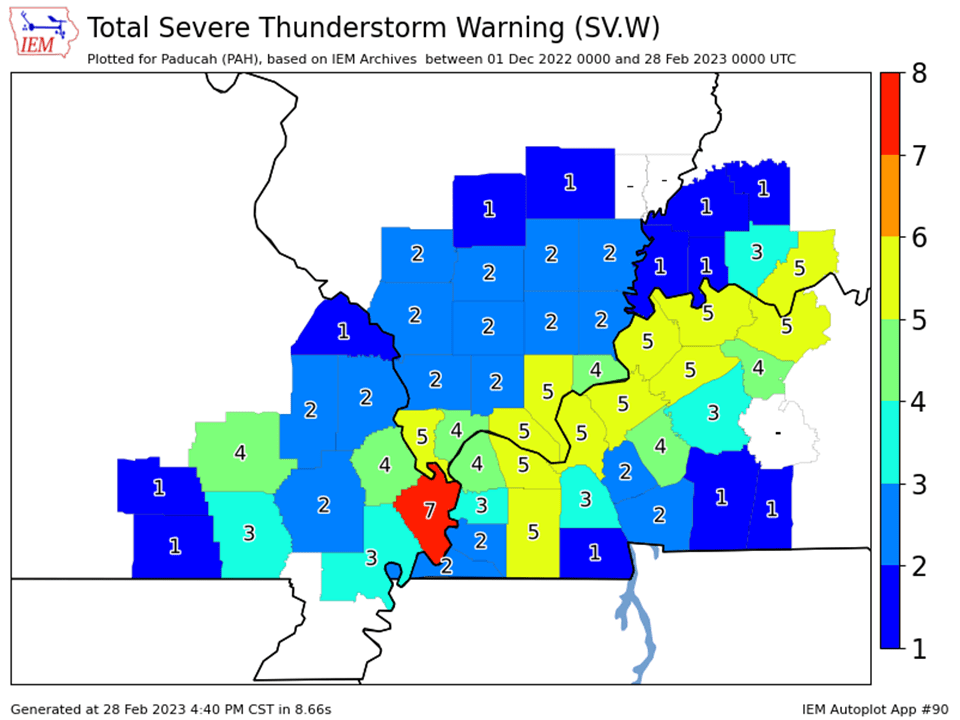
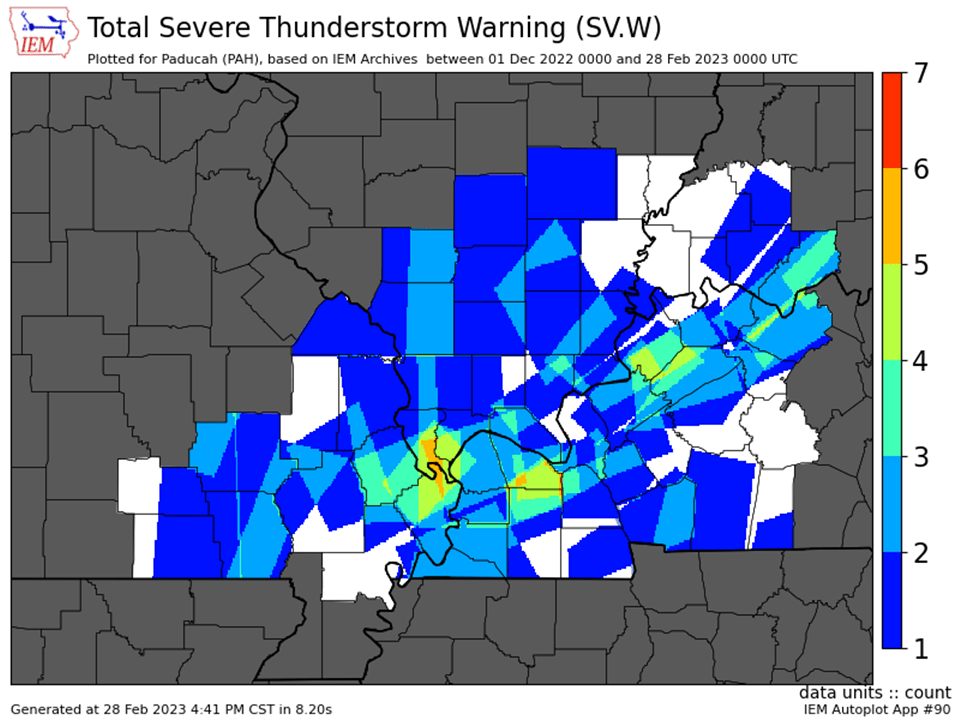
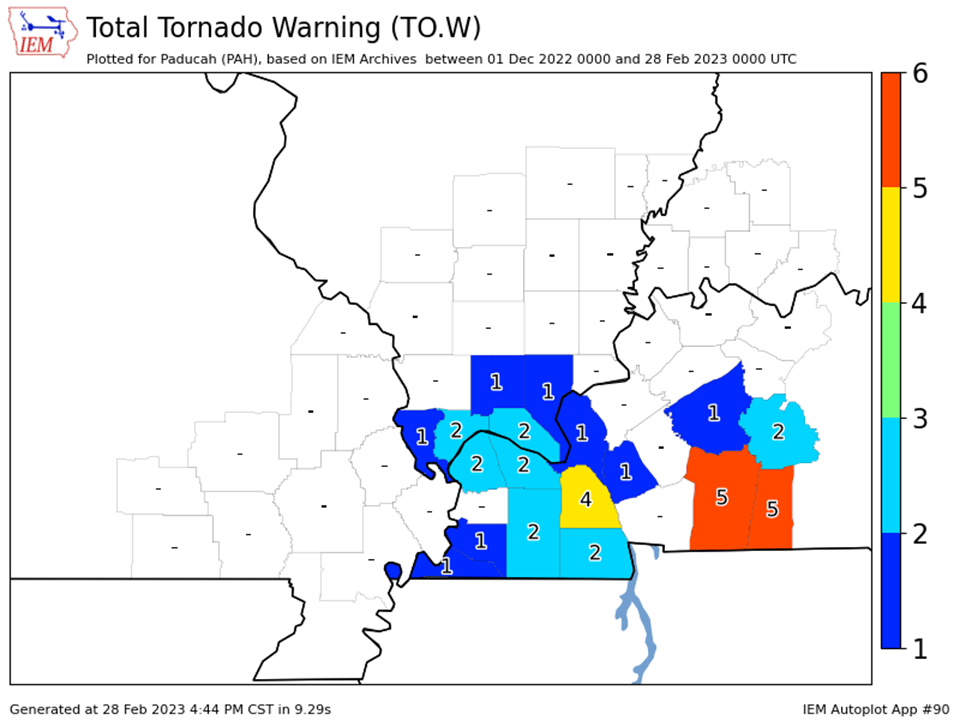
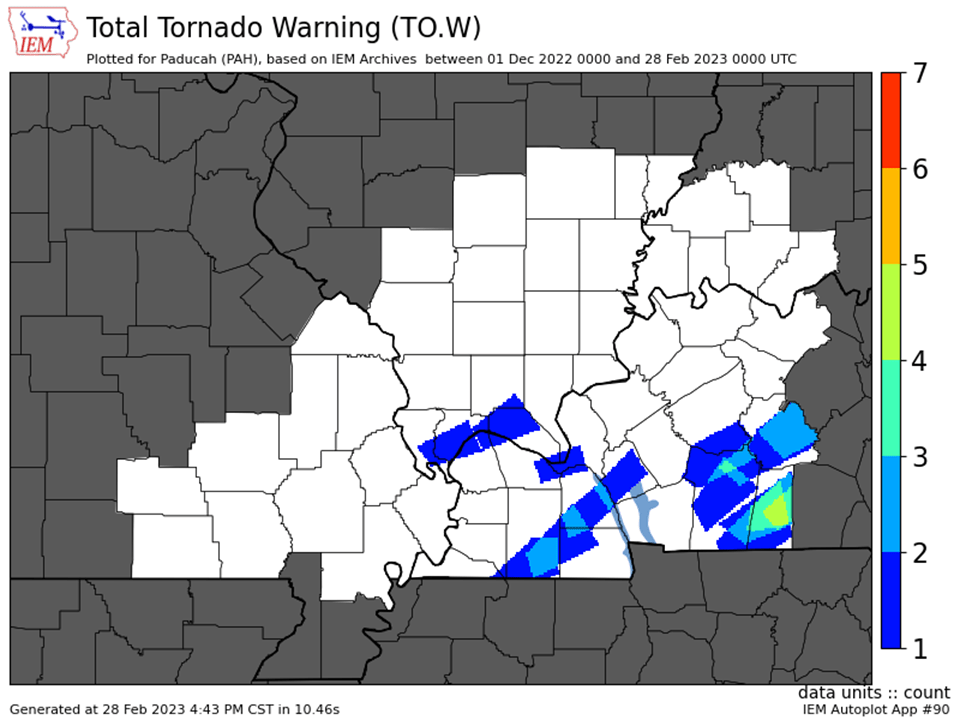
We issued 40 Severe Thunderstorm Warnings and 15 Tornado Warnings across our 58 county forecast area over the winter season (Dec 1, 2022 – Feb 28, 2023). This was a bit above the average of 25 combined warnings in a typical winter, but not as many as last year when we issued 68 combined warnings. That was in large part due to the December 10th, 2021 event.
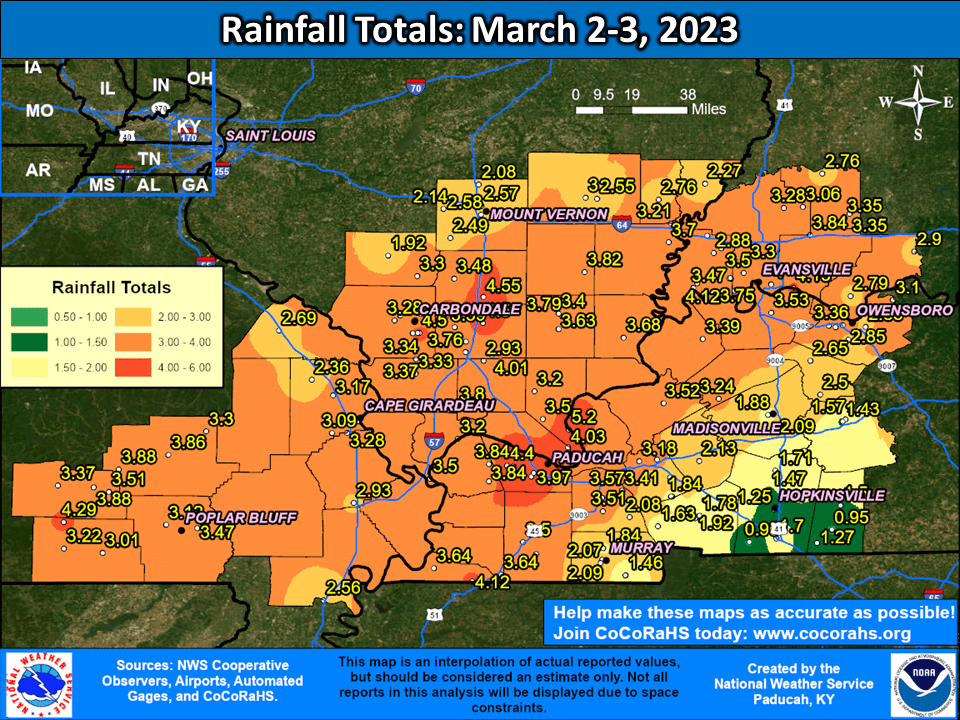
The graphic below is an interpolated rainfall map using actual observations. Please note that there are likely discrepancies in between observations, since the values are estimated based on nearest reports.
Fall 2022 Review: Precipitation and Temperature Maps
Seasonal summary.
Winter season report card.
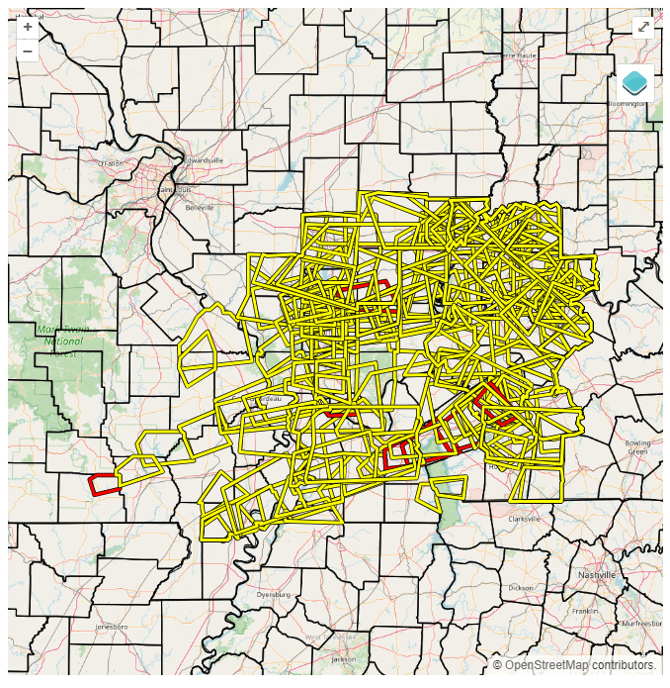
The graphics below show all of the severe thunderstorm and tornado warnings issued across our 58 county forecast area during the December through February period.
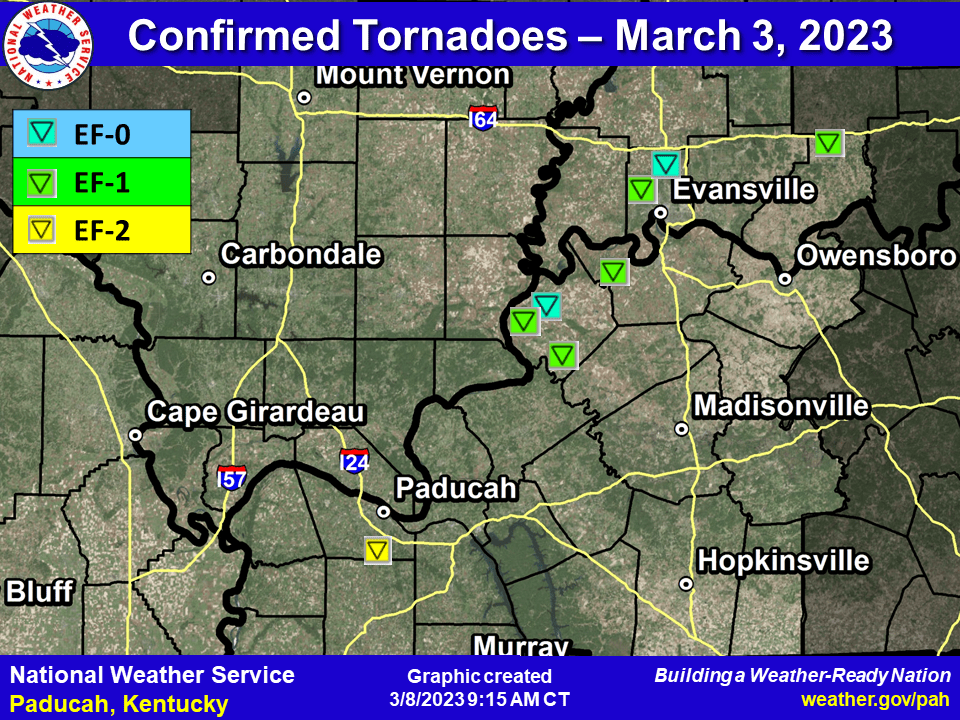
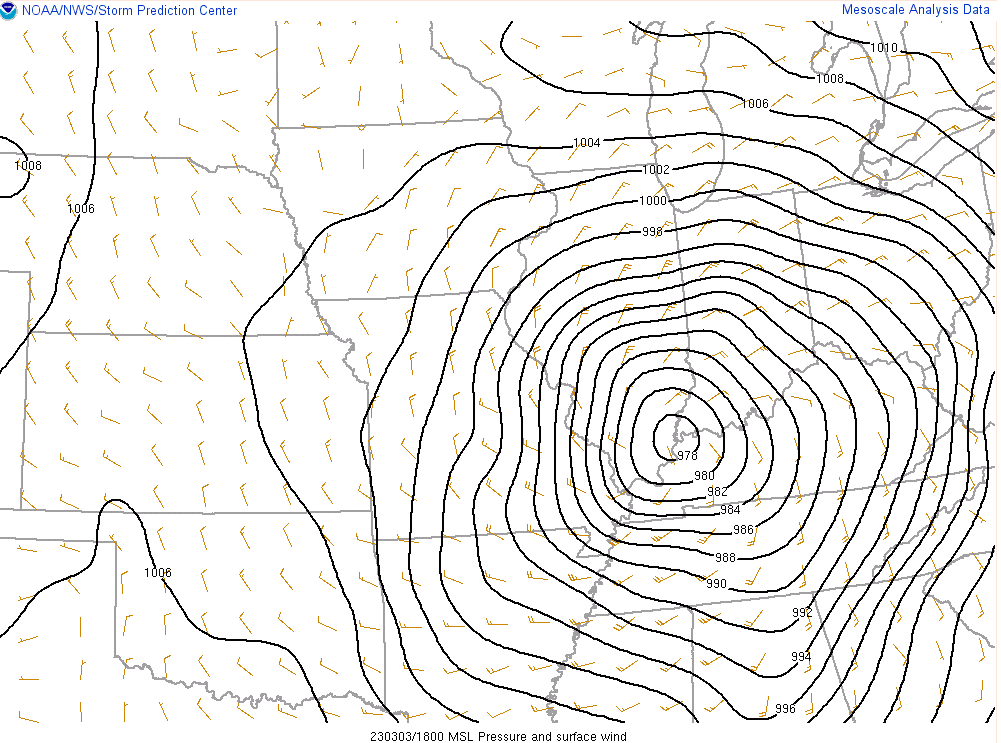
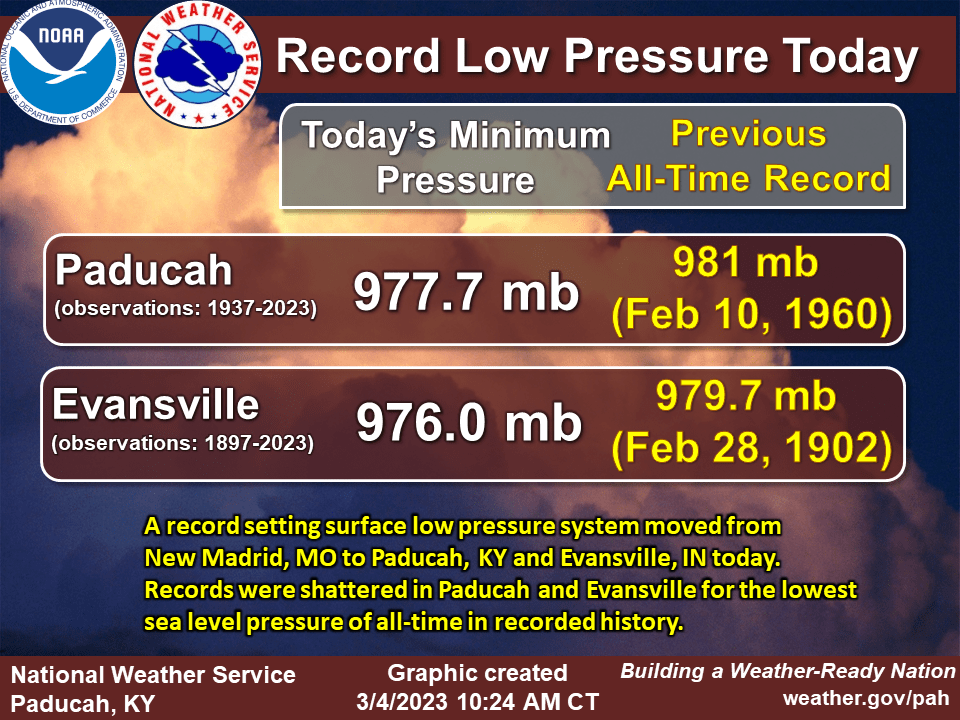
Summary of the March 3, 2023 events. Tornadoes, flooding, strong gradient winds, and all-time lowest surface pressure
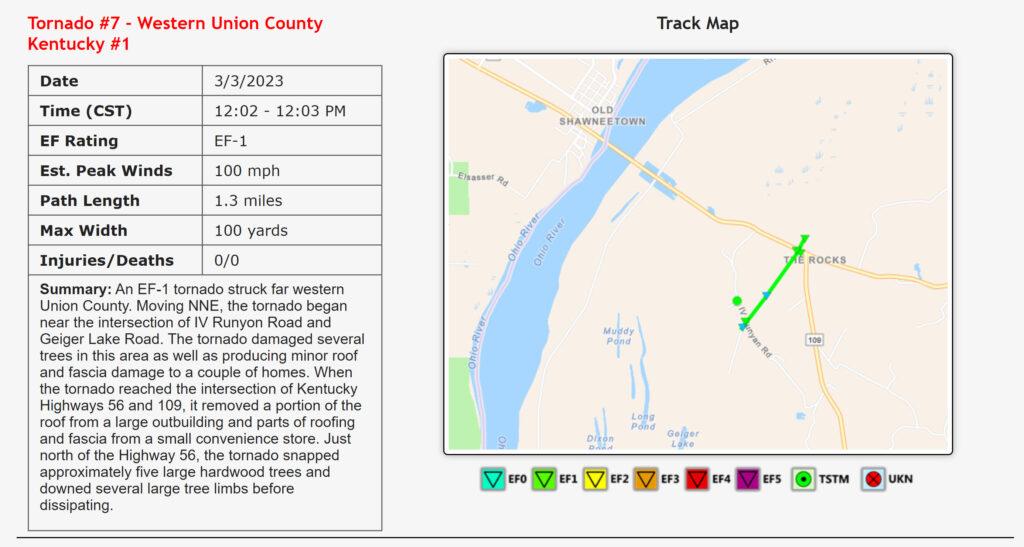
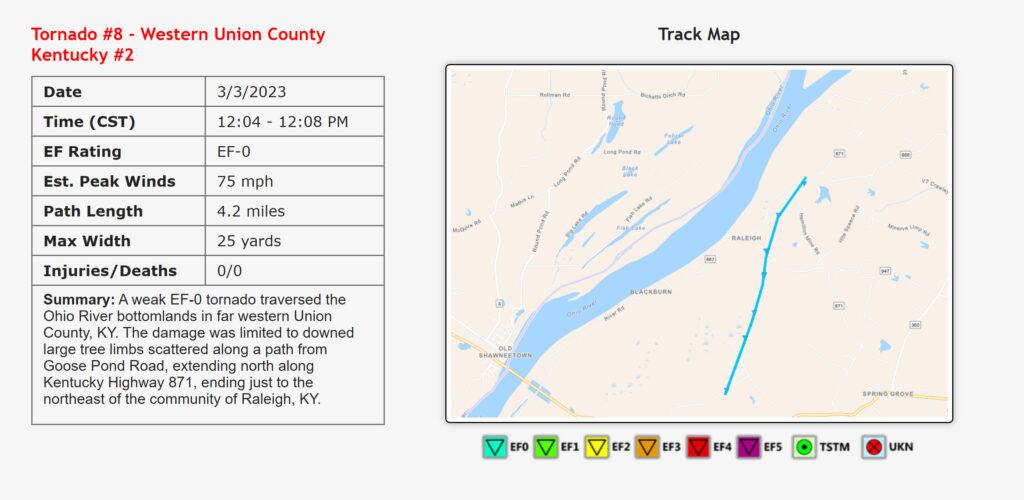
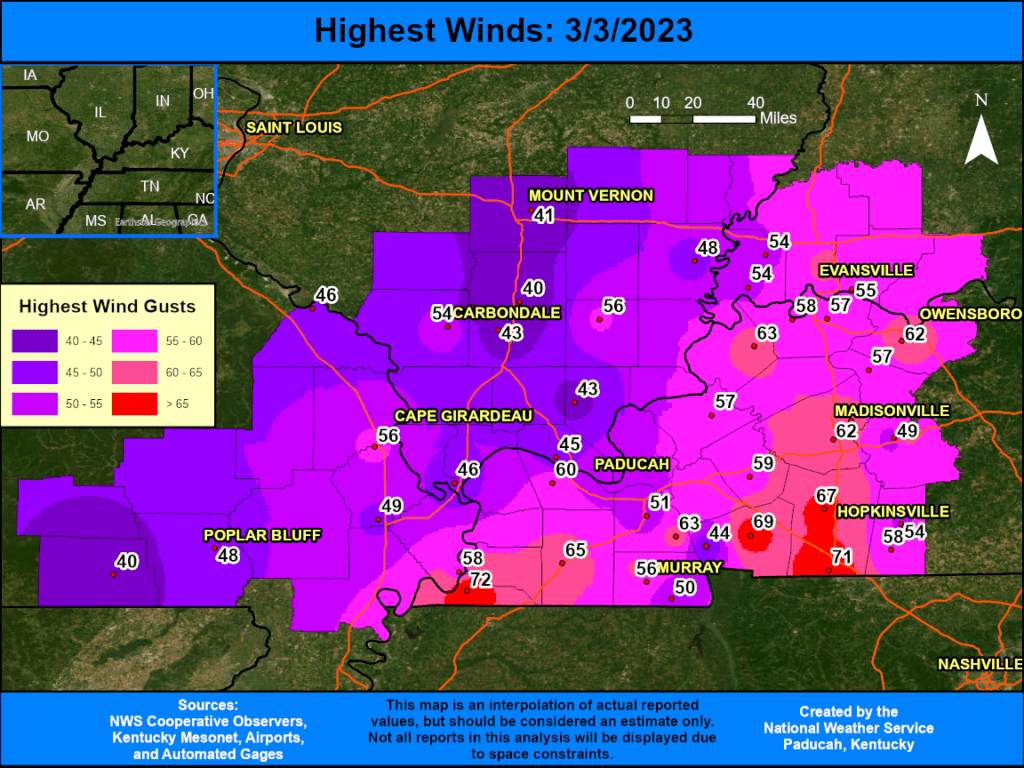
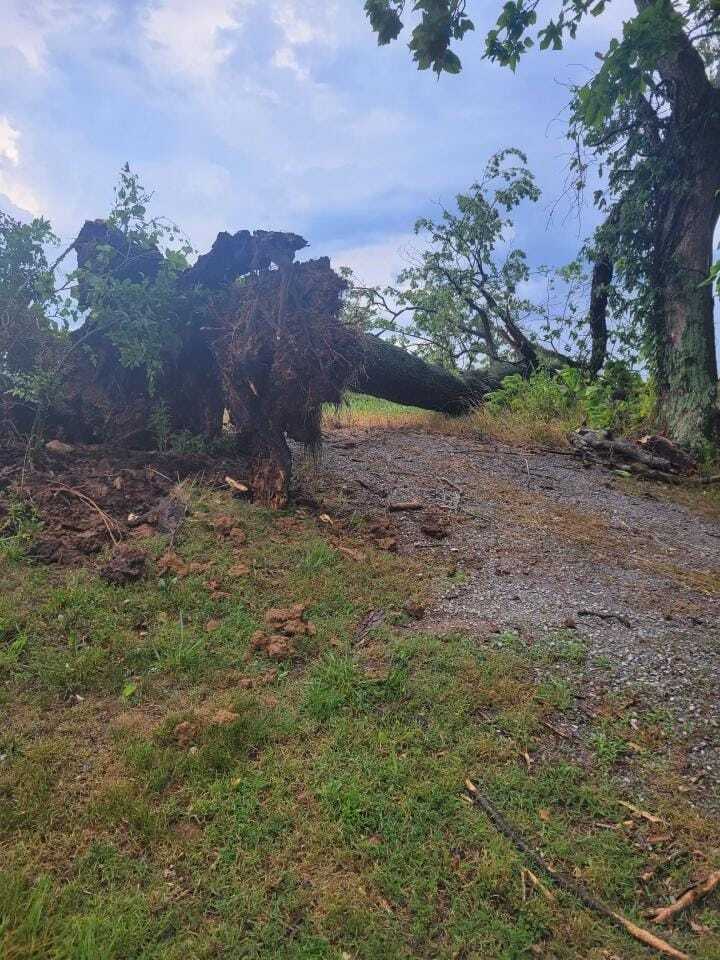
A strong storm system led to significant impacts across our region on March 3, 2023. Heavy rainfall amounts of 3 to 4.5 inches produced widespread flash flooding with numerous road closures. Very strong winds occurred, ranging between 50 and 70 mph. These were associated with both thunderstorms and gradient winds afterwards. The line of storms moved through during the late morning and midday time period, and then very strong winds continued for hours afterwards through the afternoon. NWS Paducah issued a rare High Wind Warning to account for the strong winds that persisted for hours. The magnitude and duration of this wind produced significant damage to trees, power lines, homes, etc. Soggy ground due to the excessive rainfall likely contributed to some trees being more susceptible to being blown over. Numerous power outages occurred, particularly across western Kentucky. 8 tornadoes occurred along the line of thunderstorms across west Kentucky and southwest Indiana. This included an EF-2 tornado that occurred just south of Paducah, KY shortly after 11 AM. Finally, the lowest barometric pressure of all-time was observed in Paducah (977.7 mb) and Evansville, IN (976.0 mb).
The Freemont, Kentucky Tornado
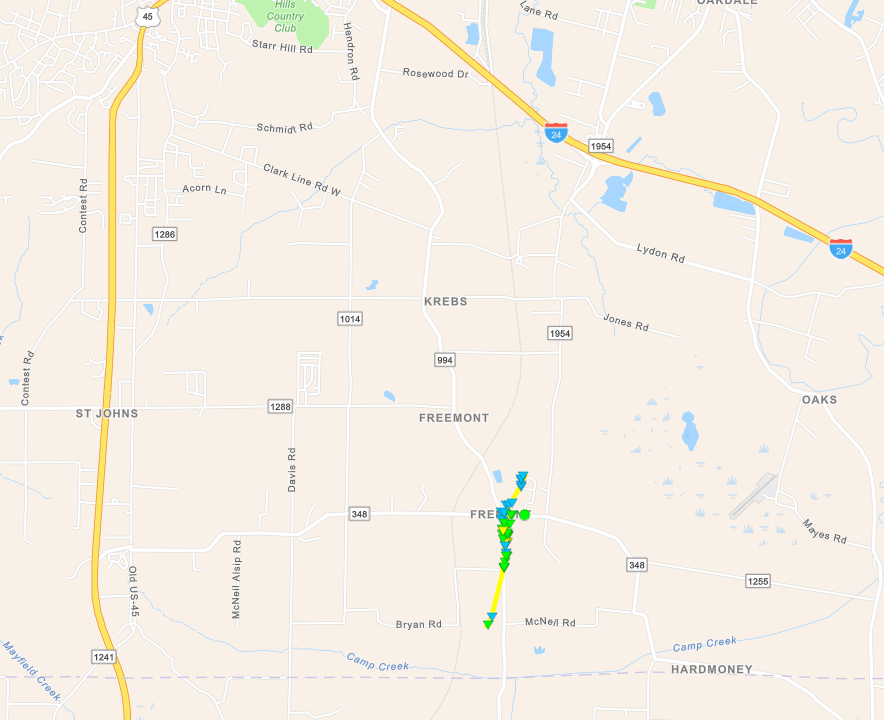
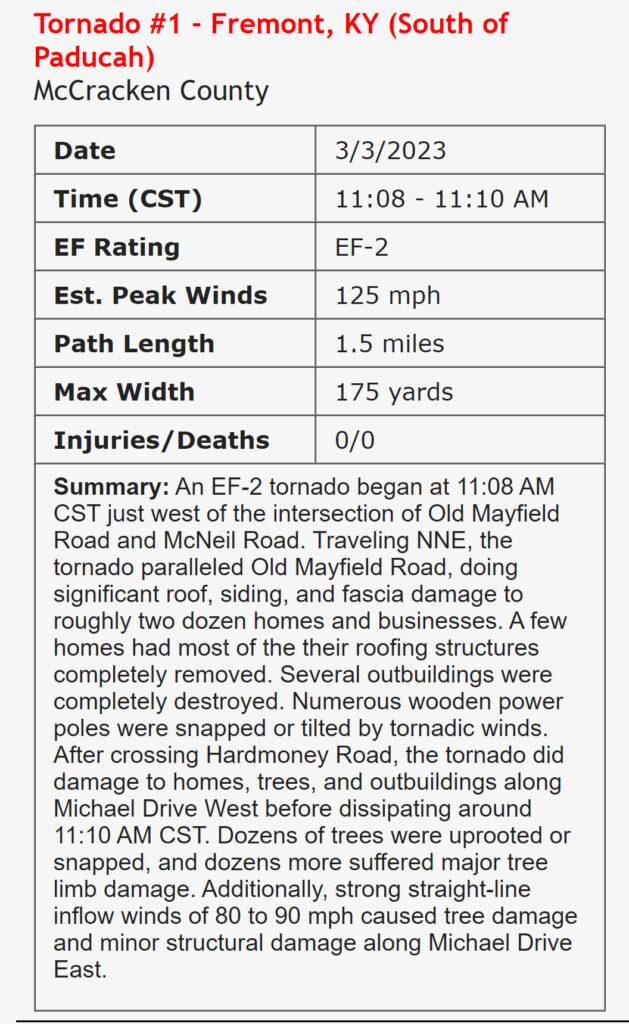
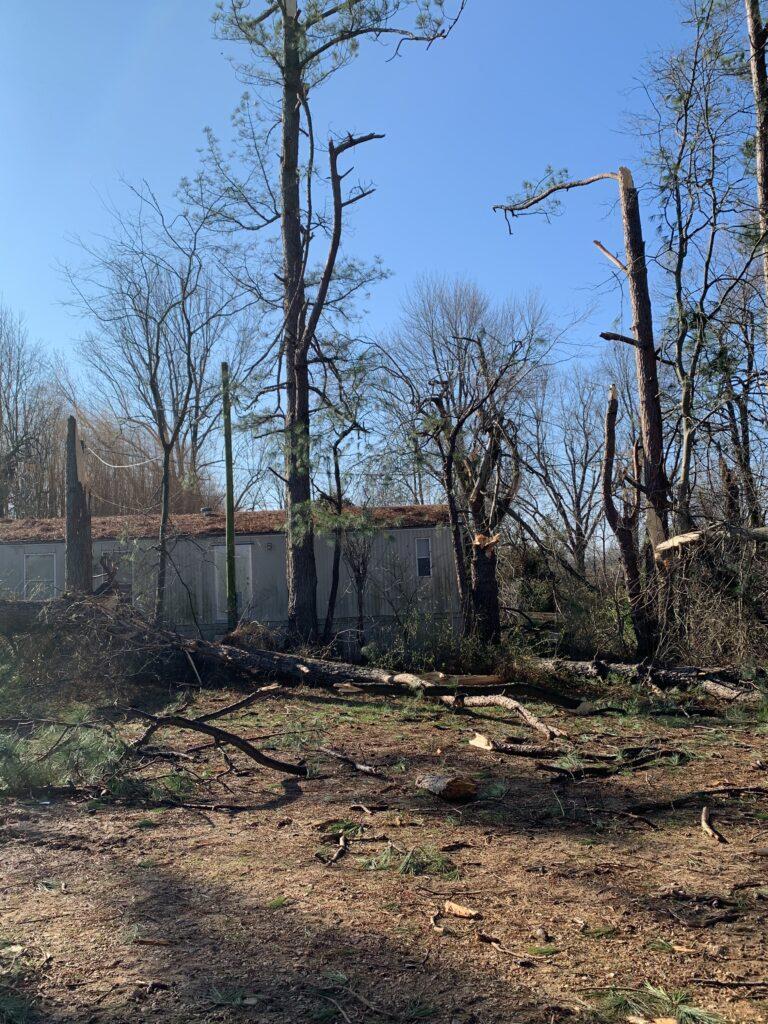
NWS Storm Survey of Tornado damage
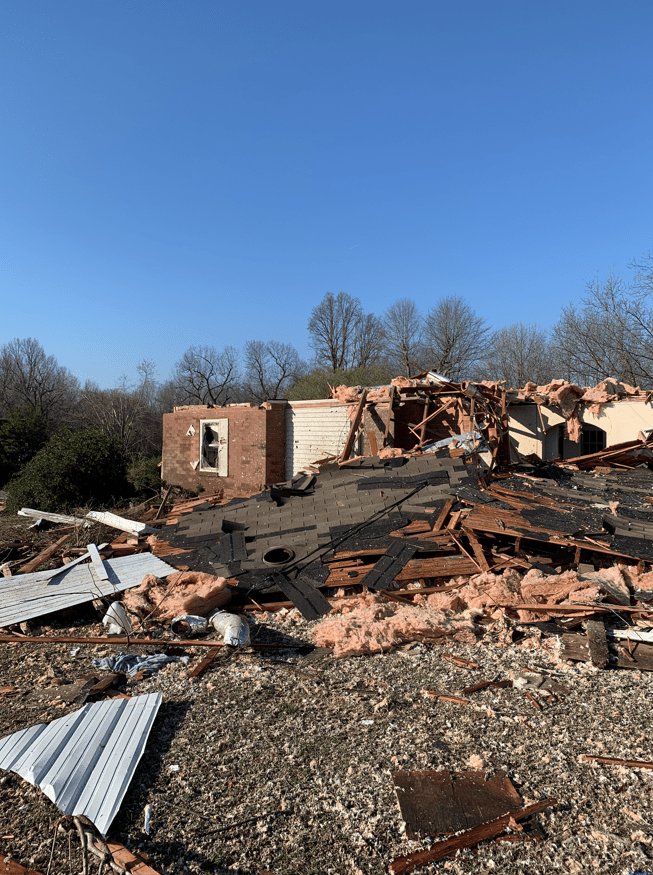
NWS Storm Survey of Tornado damage
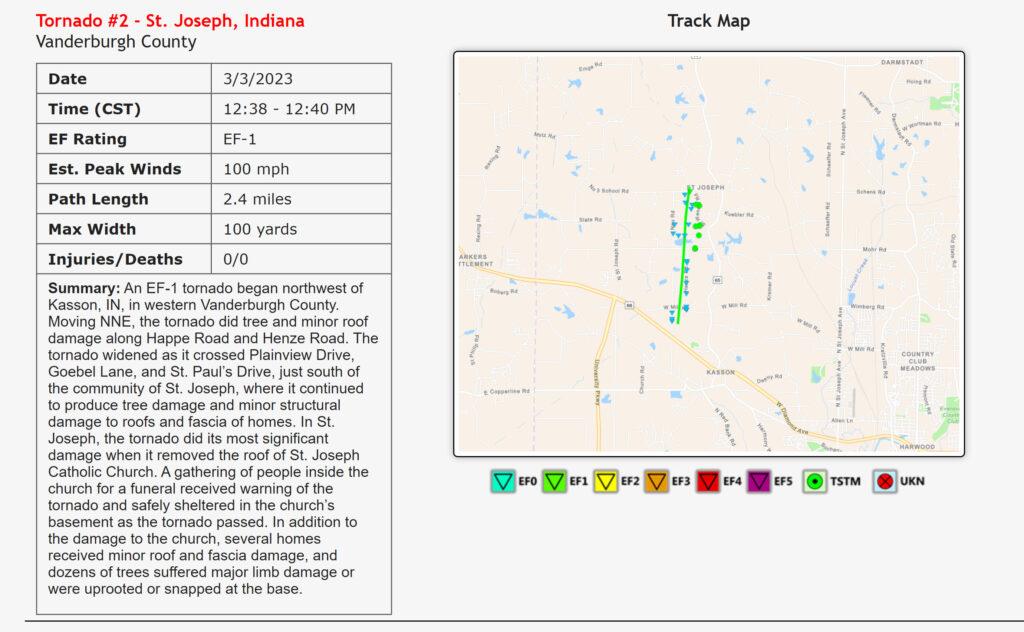
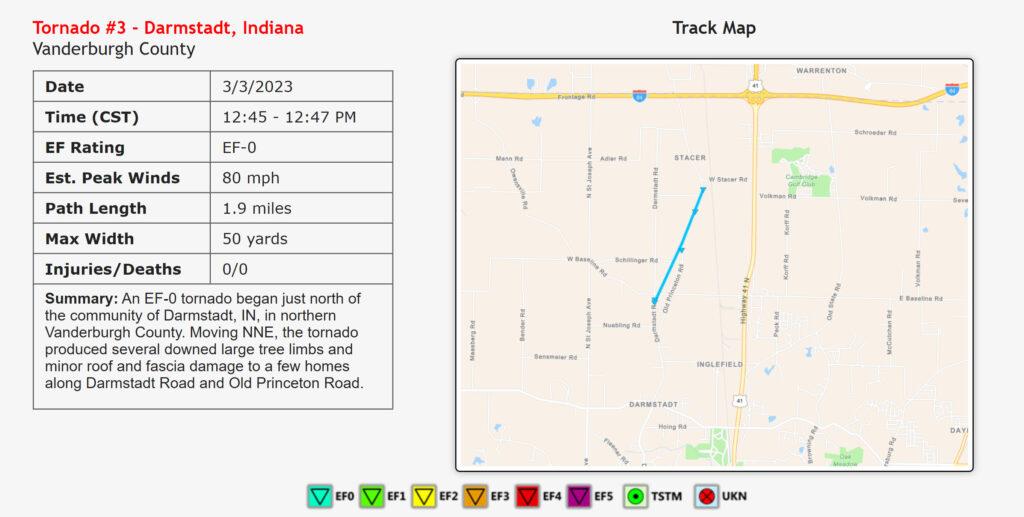
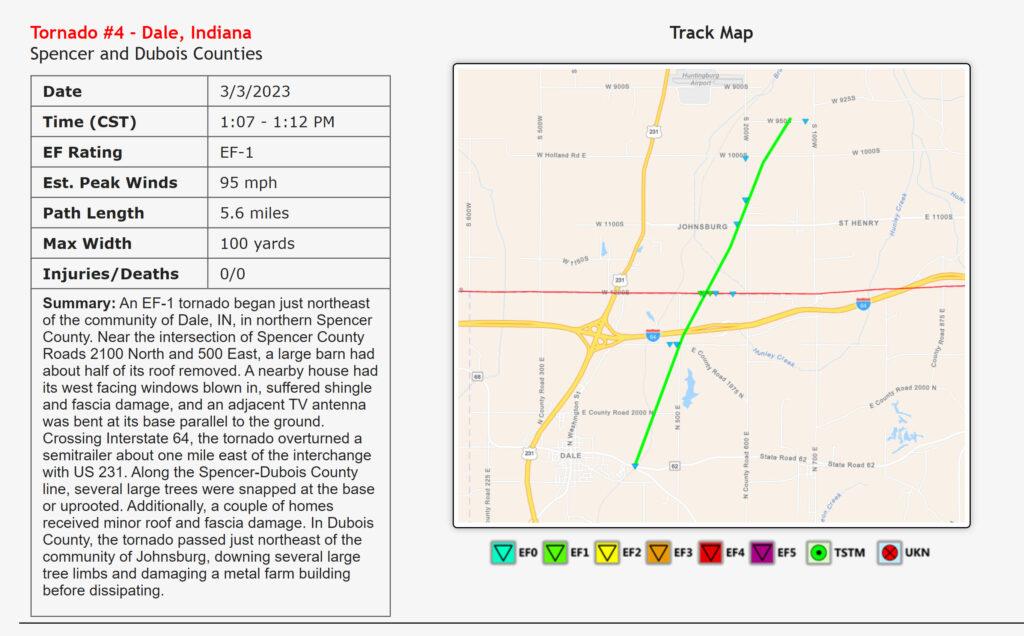
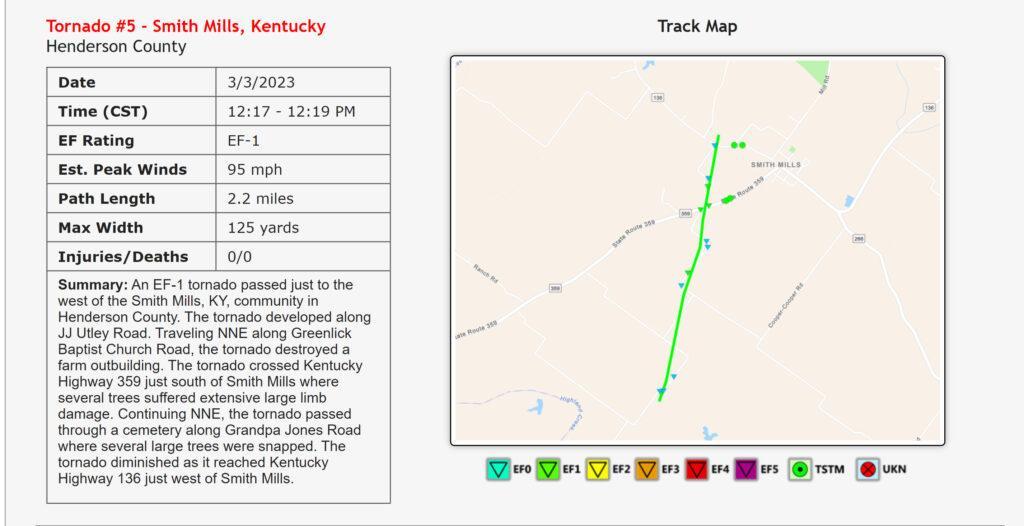
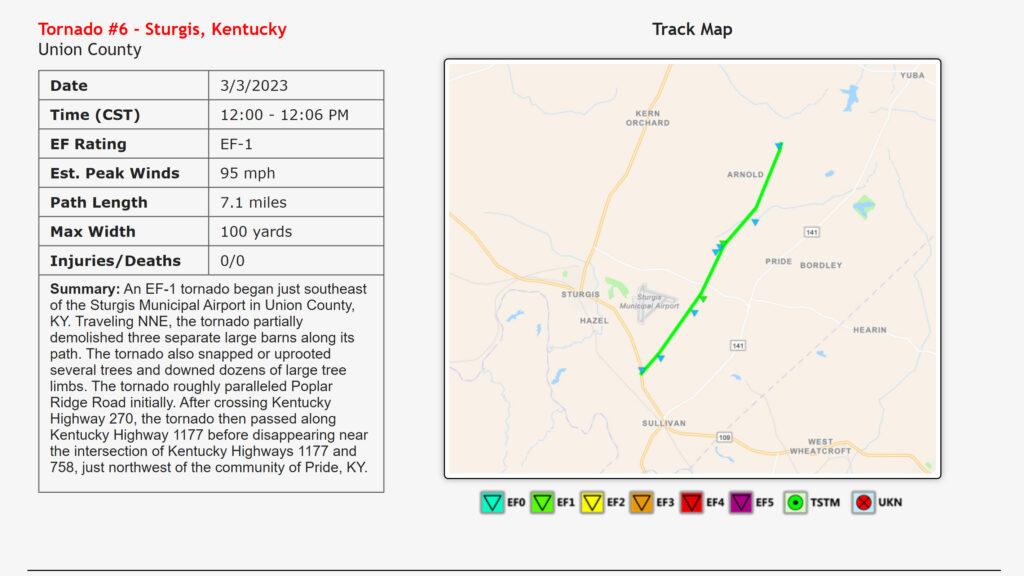
Additional tornadoes that struck the area.
Record low pressure.
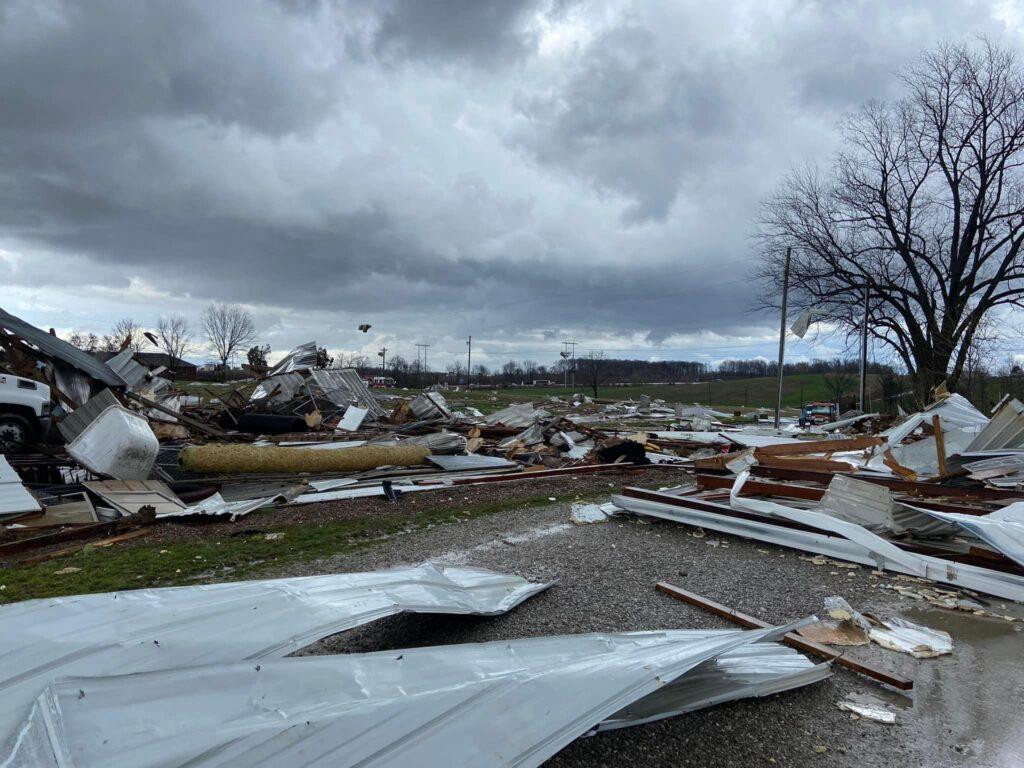
Storm damage in Dale, IN – courtesy of HeisenbergFX4 on Twitter. More photos here.
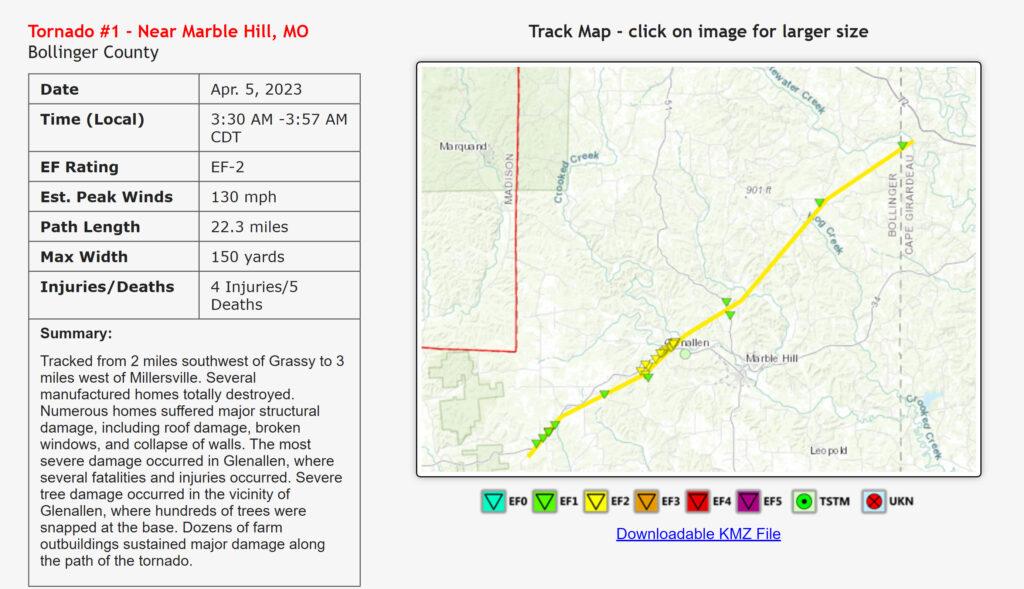
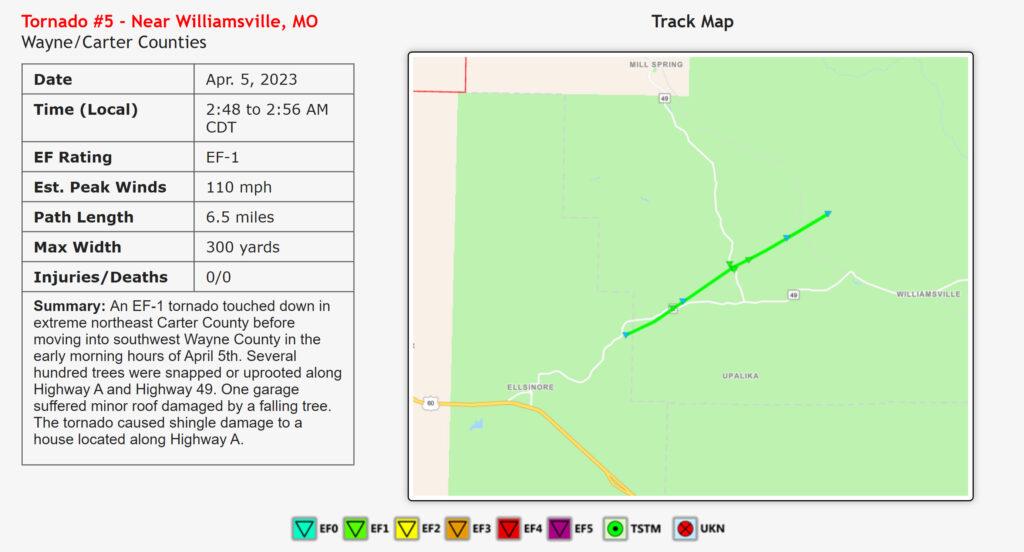
April 5, 2023. EF-2 tornado in Glenallen, Missouri causes 5 fatalities. Additional tornadoes strike Kentucky and Indiana.
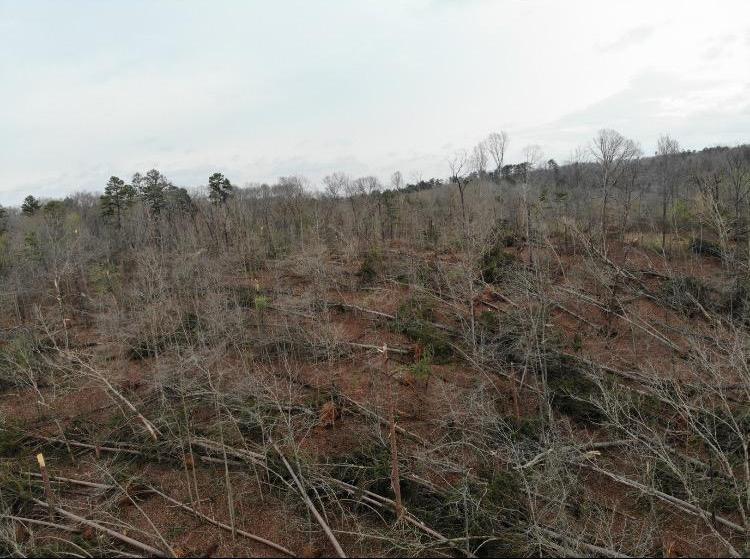
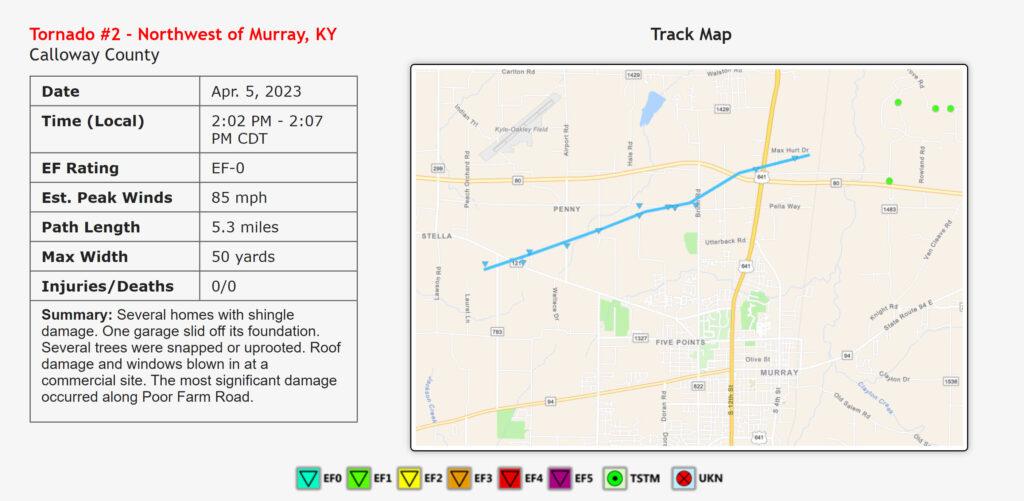
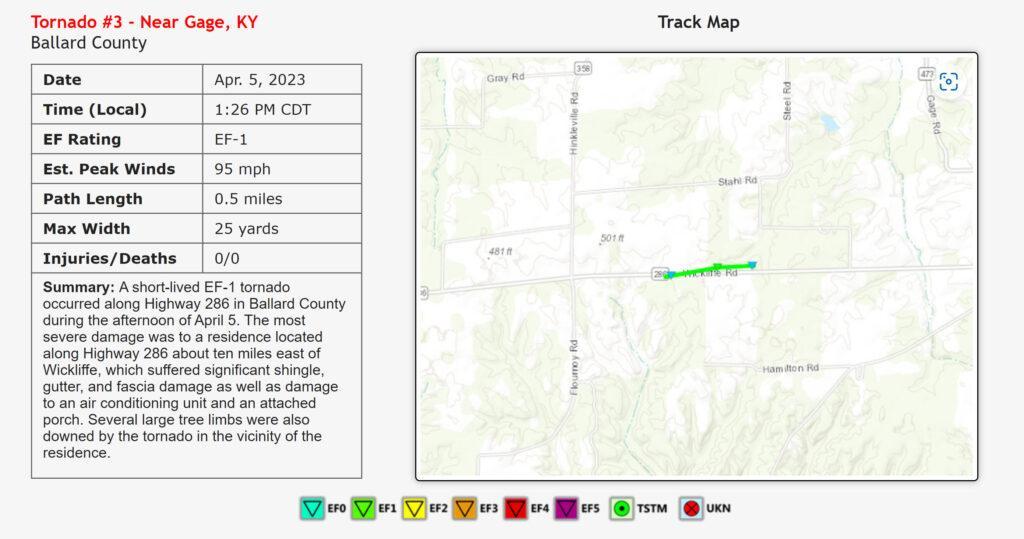
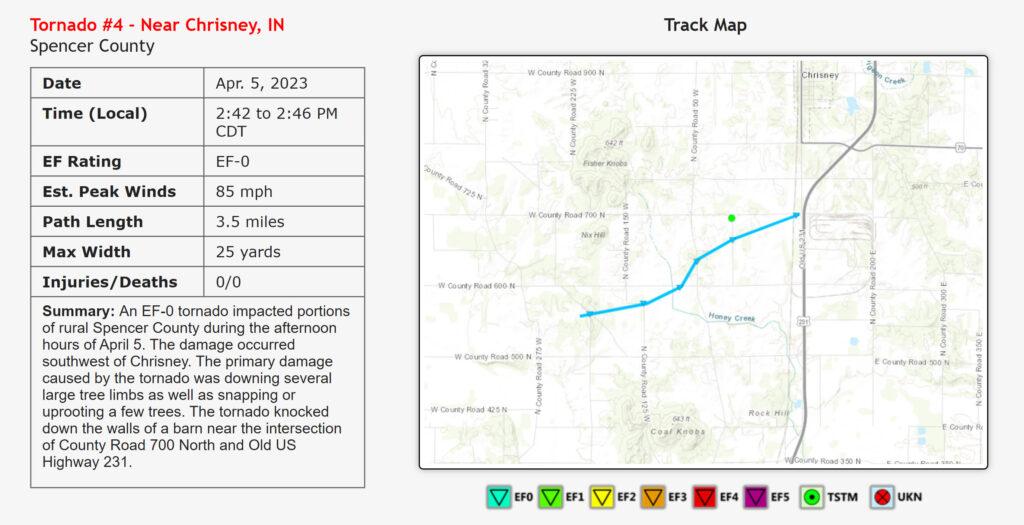
Two organized severe weather outbreaks occurred on April 5. The first outbreak, which consisted of a series of supercell thunderstorms, included the deadly Bollinger County tornado in southeast Missouri. This outbreak was during the pre-dawn hours, from about 2 AM to 6 AM. The second outbreak consisted of a broken squall line of thunderstorms that moved east across the region from mid- morning through mid-afternoon. Pockets of damaging wind accompanied these storms, along with a few brief tornadoes.
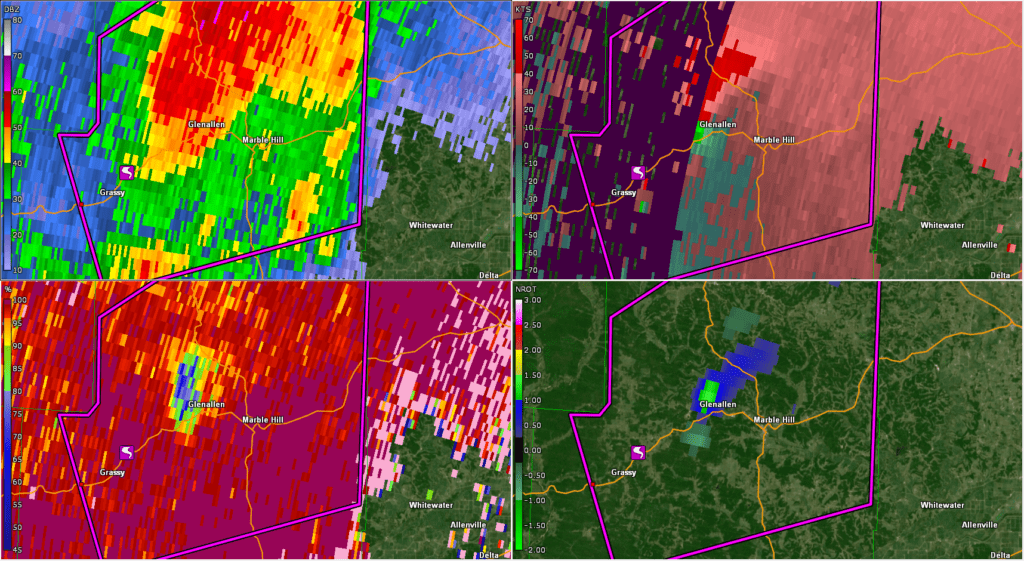
Radar of the tornado.
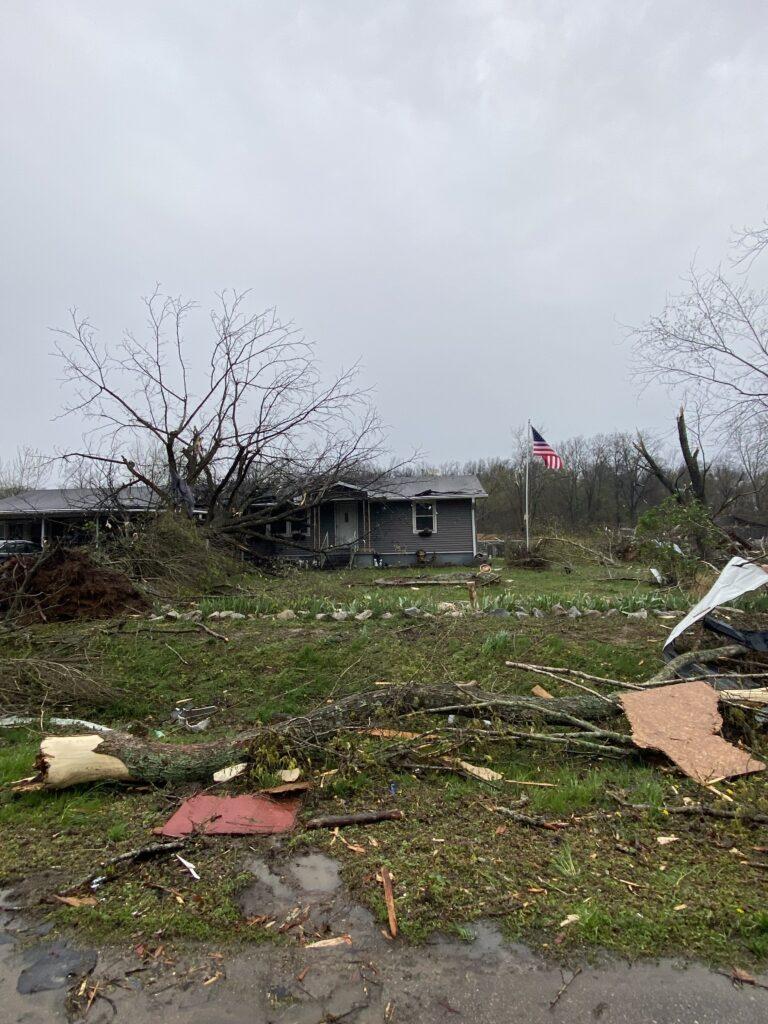
Tornado damage in Bollinger County, Missouri. (NWS damage survey)
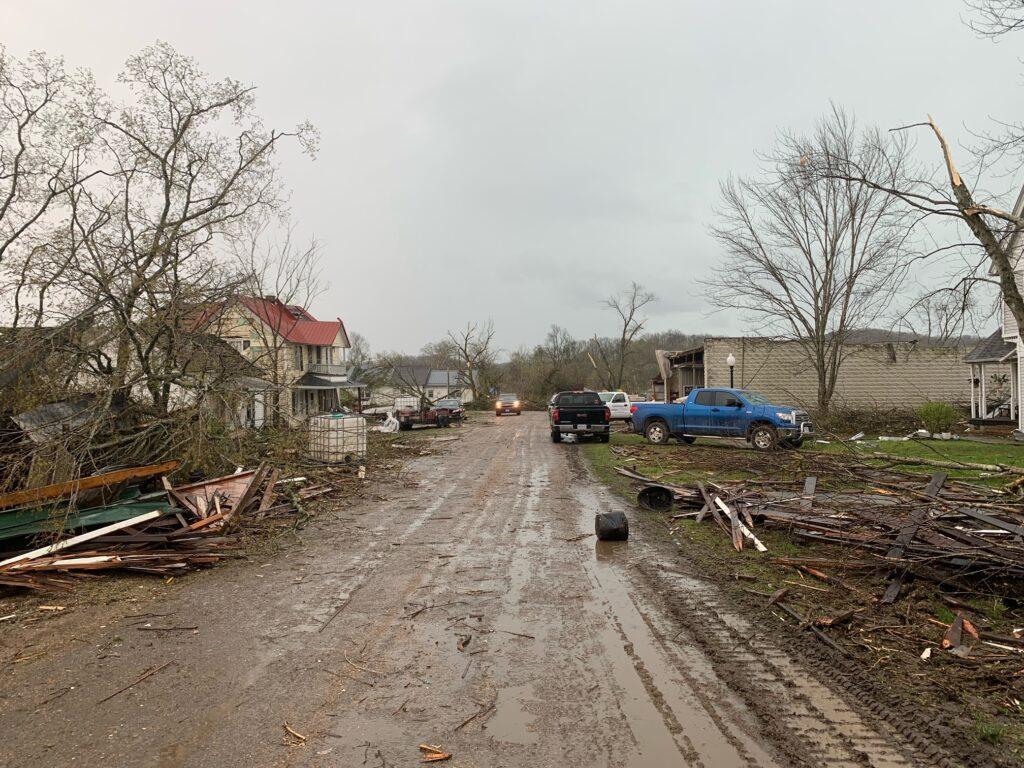
Tornado damage in Glenallen, Missouri. (NWS damage survey)
Tree damage south of Mill Spring in Wayne County, Missouri.
(Wayne County EMA)
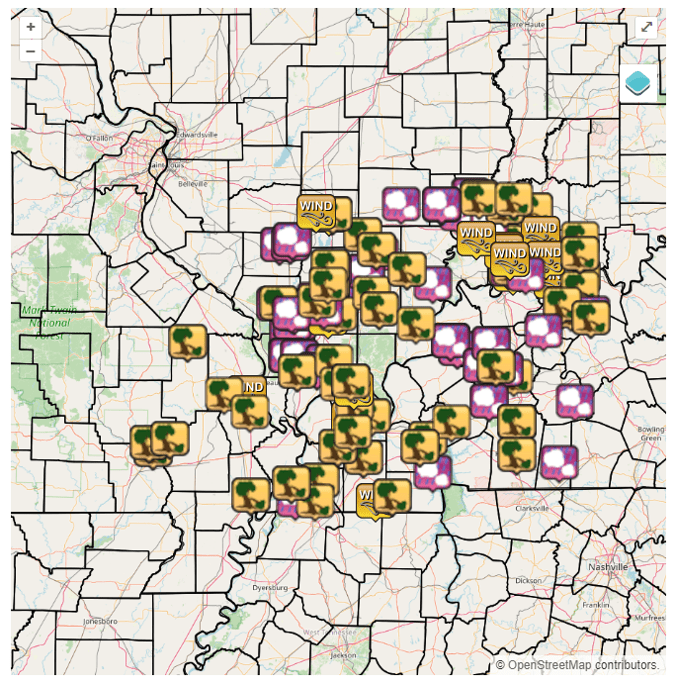
June 29th through July 2nd. Very active 4-day period with numerous roads of severe thunderstorms. Total of 238 reports of large hail, damaging winds, or severe wind gusts across our area.
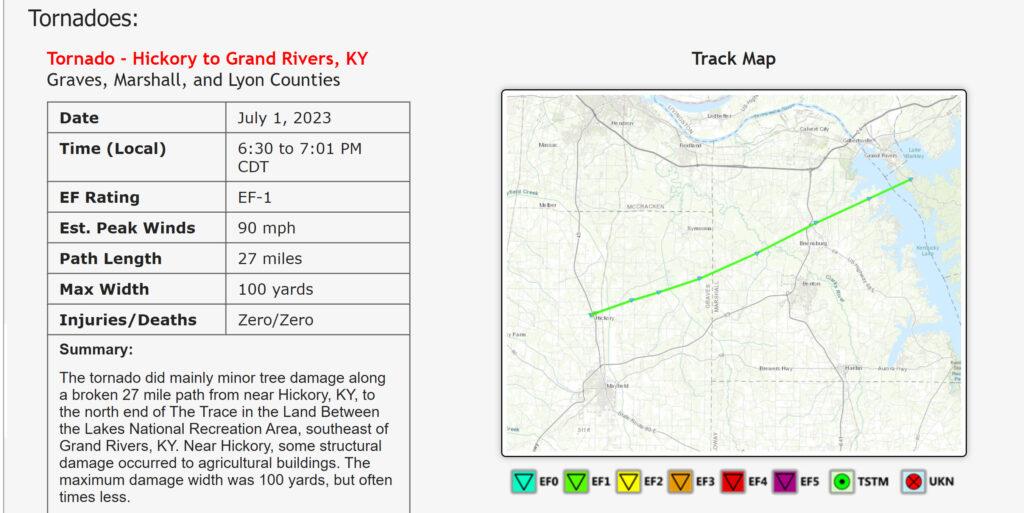
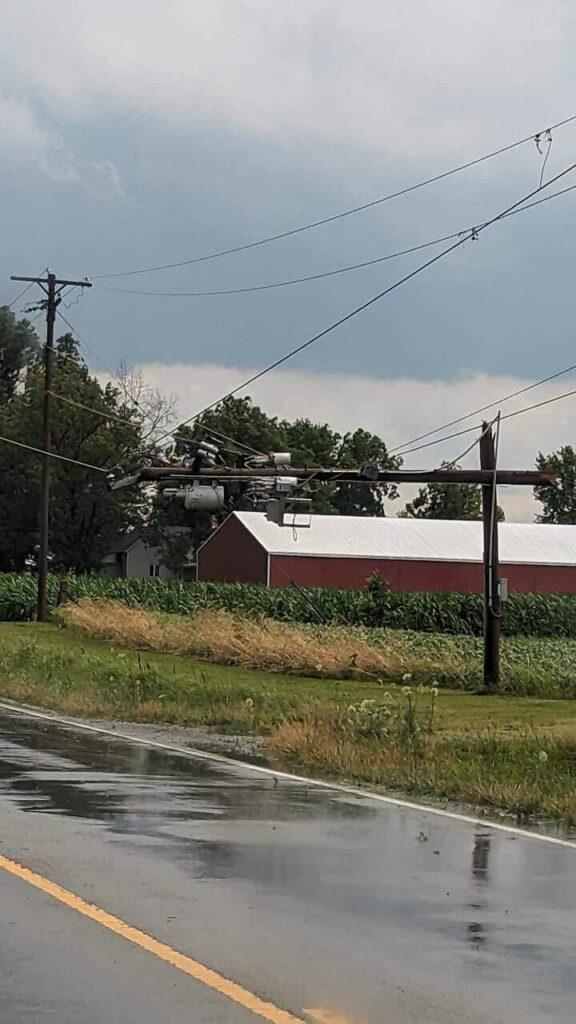
An extremely active period of severe weather impacted the region for four consecutive days, between June 29 and July 2, 2023. Numerous rounds of severe thunderstorms produce large hail up to three inches in diameter and destructive damaging winds. The Wabash Valley and Evansville Tri-State area were impacted particularly hard, with several hundred people losing power for multiple days due to repeated rounds of severe thunderstorms. A long-track EF-1 tornado struck Graves, Marshall, and Lyon counties in western Kentucky on the evening of July 1.
Downed power poles in Gibson County, IN (Win Energy REMC)
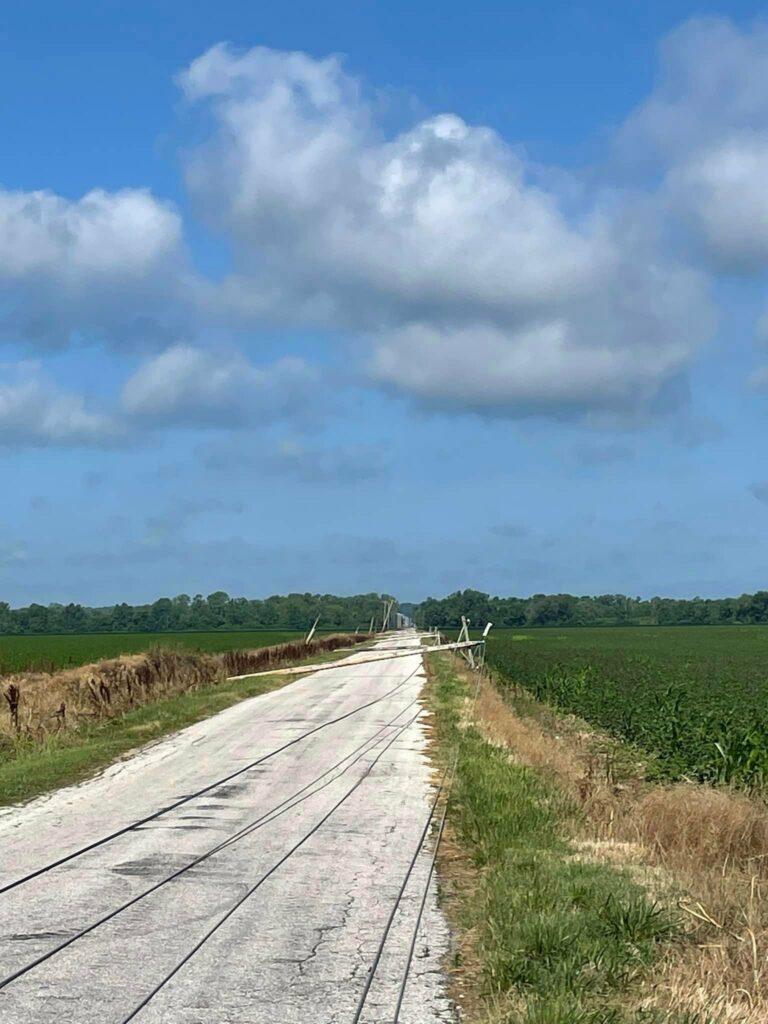
More photos here
New Columbia, Illinois wind damage.
Snapped power pole in Williamson County, IL
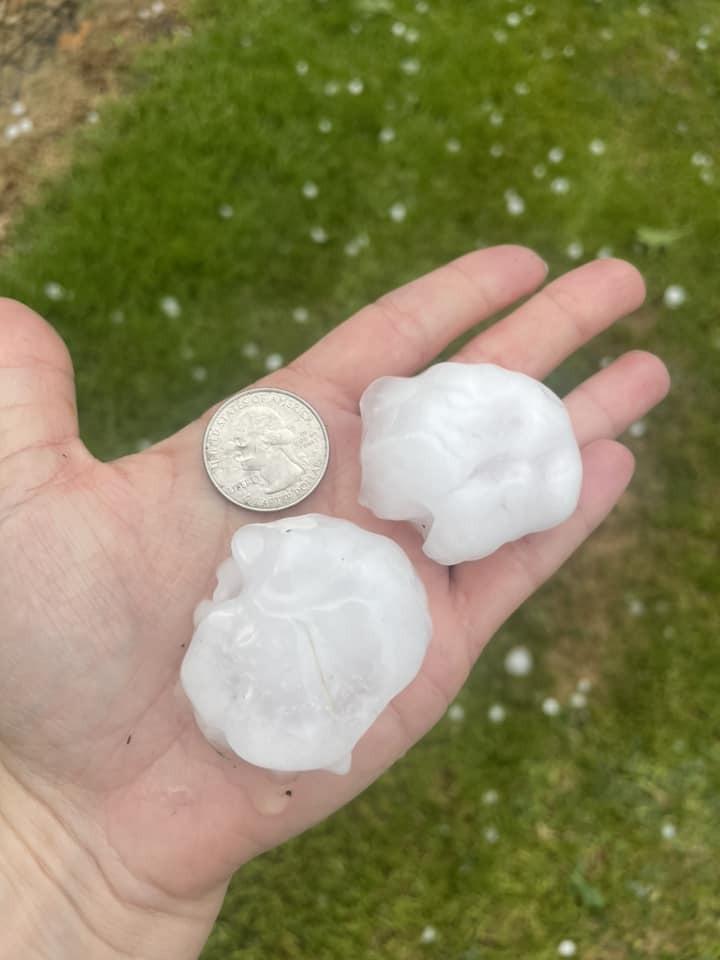
Golf ball size hail in Benton, IL
During the June 29 to July 2, 2023, period, NWS Paducah issued 154 severe thunderstorm and tornado warnings for our county warning area.
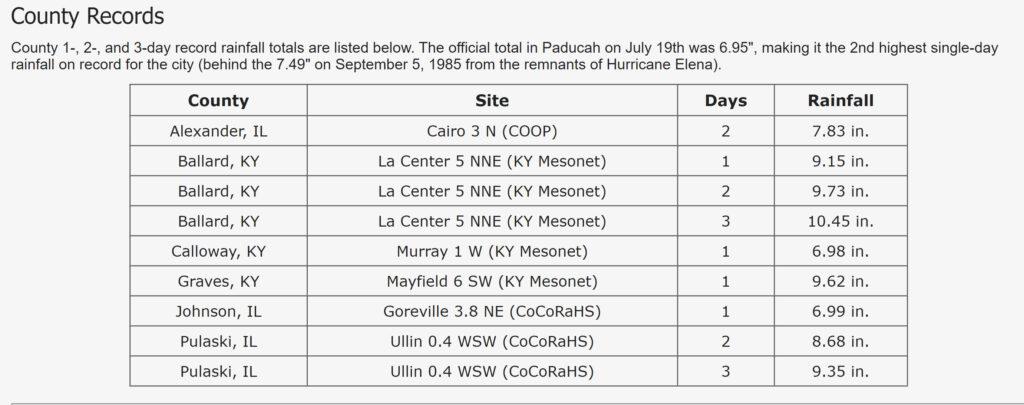
July 19, 2023. Historic flash flooding across portions of KY, IL, and MO. New 24-hour state record established in KY with 11.28″ at the Graves County mesonet station.
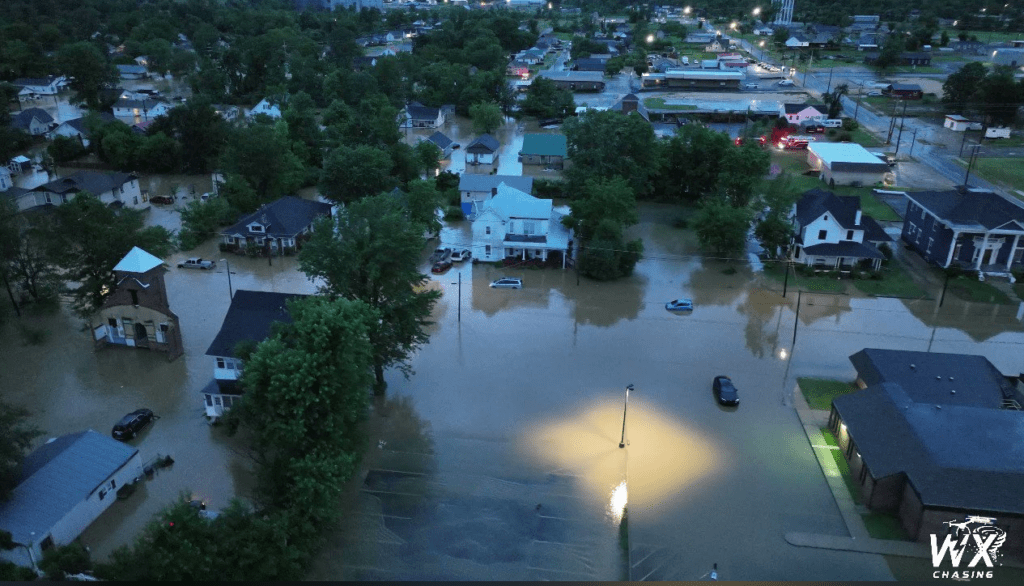
A historic flash flooding event unfolded during the overnight and into the morning hours on July 19, 2023 across far western Kentucky into portions of southern Illinois. Widespread rainfall totals ranging from 6 to 12 inches occurred from Cape Girardeau to Paducah, Mayfield, and Murray. The majority of this rain fell within a 10 hour window between Midnight and 10 AM. Among the hardest hit counties was Graves County, which had not completely recovered from a catastrophic tornado in December of 2021. Widespread flash flooding of roads made travel difficult or impossible for several hours during the peak of the heaviest rainfall in the morning. The city of Mayfield, which bore the brunt of the December 2021 tornado, experienced catastrophic flooding that inundated many homes, businesses, schools, and various other institutions.
Our office issued 5 Flash Flood Emergencies during this event, including all or portions of Ballard, Carlisle, Hickman, Graves, and McCracken counties in Kentucky and Pulaski county in Illinois. Impacts included numerous water rescues, many homes and businesses inundated by flood waters with some people trapped in their homes, washed out roads, and dozens of roads impassable due to flood waters. At one point a section of I-57 in Pulaski County Illinois and I-69 in Graves County Kentucky were closed due to high water flowing over them. Crop damage was expected to run into the millions of dollars. At one farm alone in southern Graves County, crop damage was estimated around 40,000 dollars.
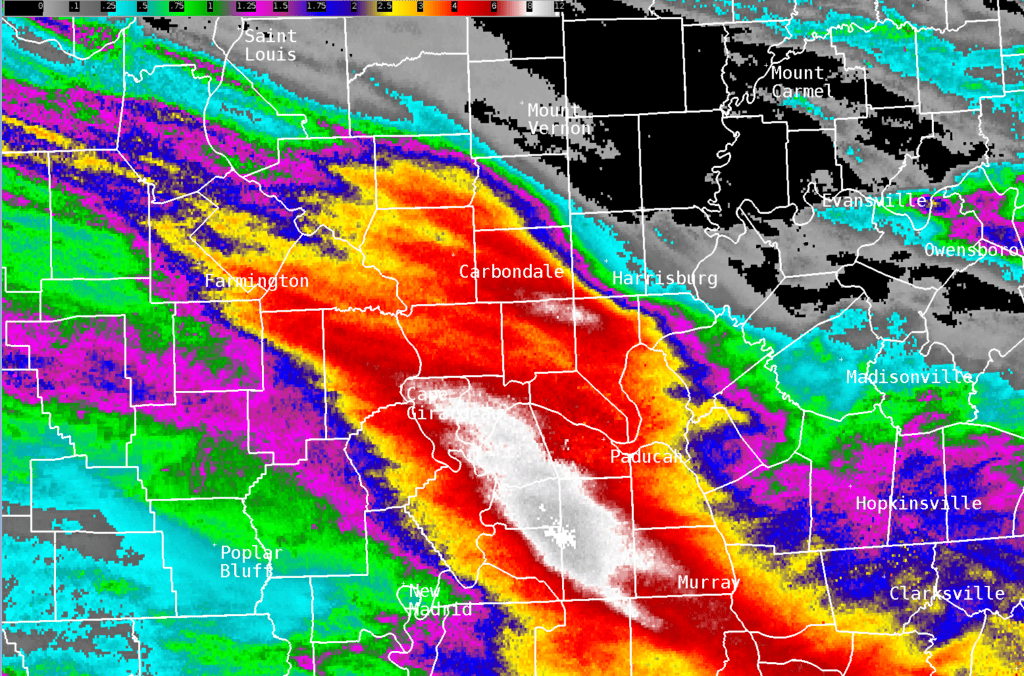
A corridor of 6 to 12 inches of rain occurred from Cape Girardeau and Carbondale southeast to Mayfield and Murray. The swath of 6+ inch amounts was roughly 25 miles wide and 90 miles long. The KY mesonet site 6 miles southwest of Mayfield received 11.28″ of rain in a 24 hour period. This broke the previous Kentucky state record for 24 hour rainfall. The old record was 10.48″ in Louisville, KY back on March 1, 1997. The highest observed amount that we received was 12.76″ from a personal weather station near Fancy Farm, KY (Graves County). The map below shows MRMS radar estimates over a 24 hour period ending at 11 AM July 19th. The majority of this rain occurred after 10 PM on July 18th.
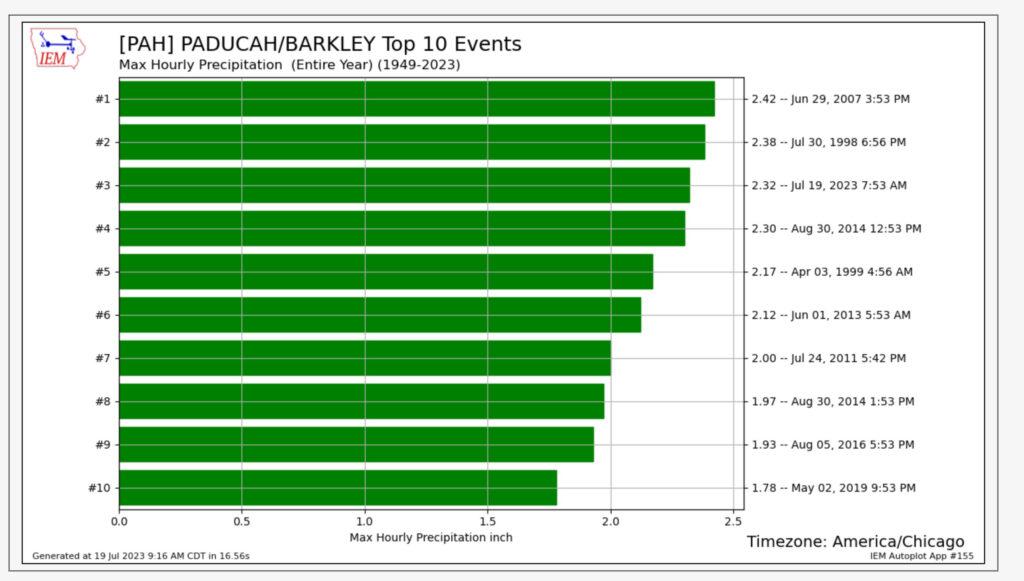
Paducah registered 2.32″ of rain between 7 and 8 AM on July 19th. This was the 3rd largest 1 hour rainfall total on record, just shy of the all-time record of 2.42″ established between 3 and 4 PM on June 29, 2007. Rainfall rates were generally 2 to 3 inches per hour across the hardest hit areas. However, some areas received 1 inch in as little as 10 to 15 minutes!
(Yellow and orange values on the map below signify amounts of 2.5 to 4″, while reds were 4 to 7″, and whites 7 to 13″)
A moderate risk of flash flooding was issued by the WPC/NOAA
Flooding in Mayfield and Murray, Kentucky. Beau Dodson photos.
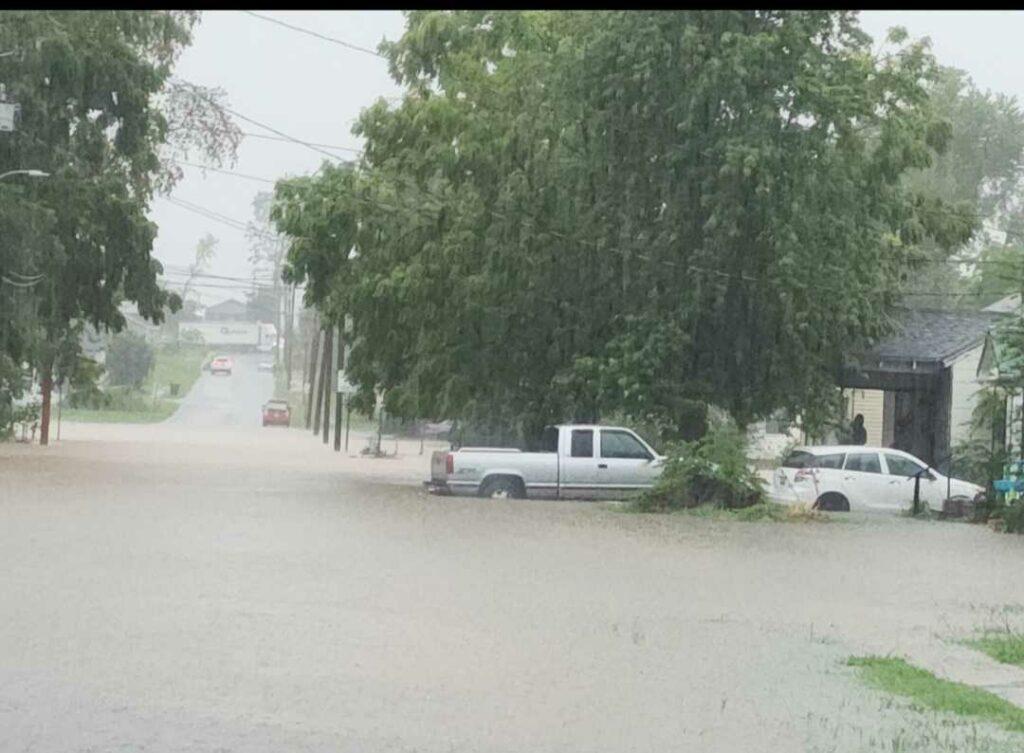
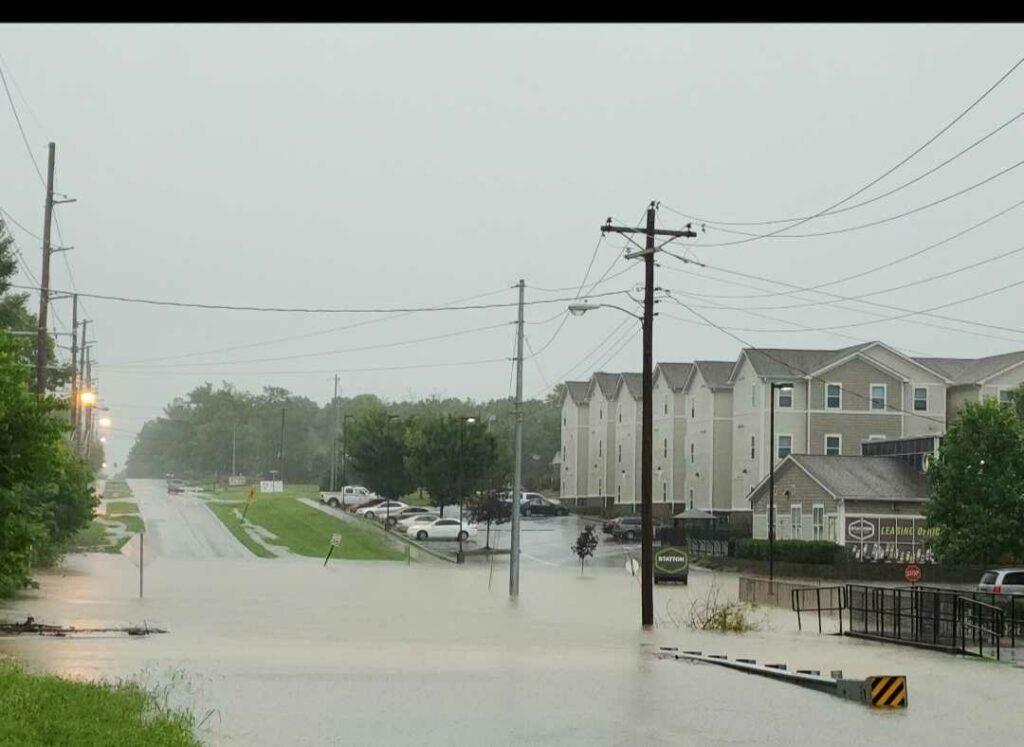
Flooding in Mayfield, Kentucky.
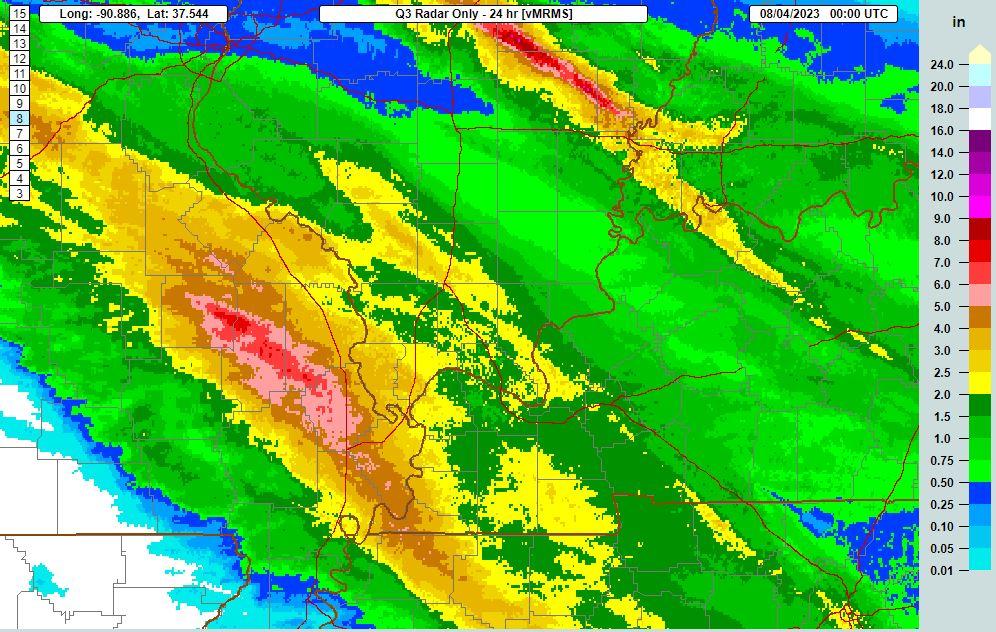
August 3rd through August 4th. Flash flooding with hardest hit areas from Marble Hill to Sikeston, MO to Hickman, KY.
Another significant flooding event occurred across southeast Missouri into far southwest Kentucky on August 3rd and 4th. This was just 2 weeks after the historic flooding that occurred on July 19th. The hardest hit areas this time were approximately one county west of the July 19th event. Locations from Marble Hill and Sikeston, Missouri southeast to Hickman, Kentucky and Union City, Tennessee observed amounts of 6 to 12 inches. There were 2 waves of heavy rain, one occurring from around midnight into the morning on August 3rd and the second from around midnight into the morning on August 4th. The environment in place allowed very efficient rainfall production as thunderstorms trained over the same locations.
48 Hour MRMS rainfall estimates ending at 7 PM August 4th (graphic below)
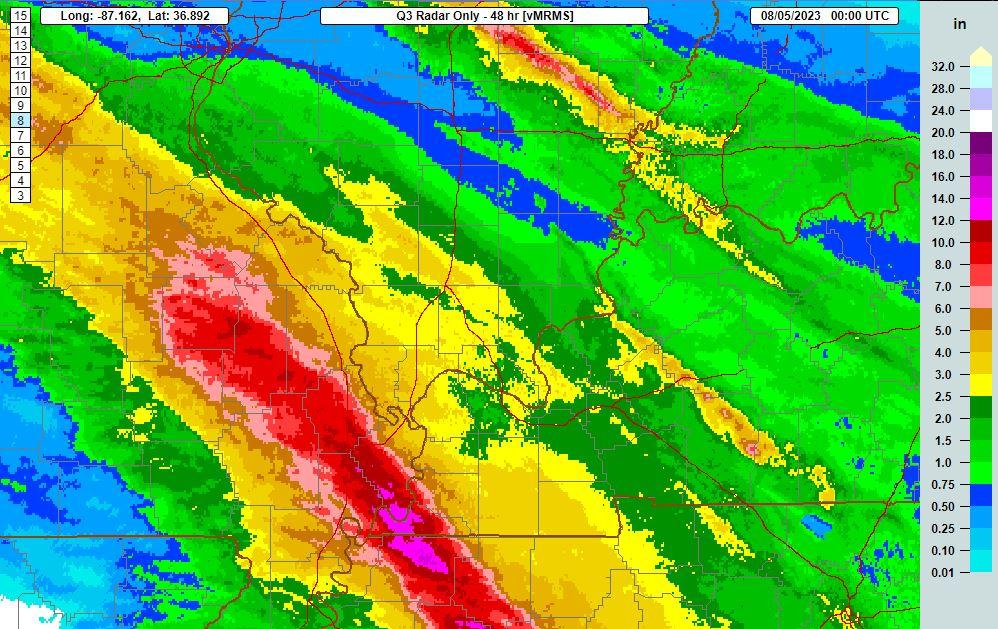
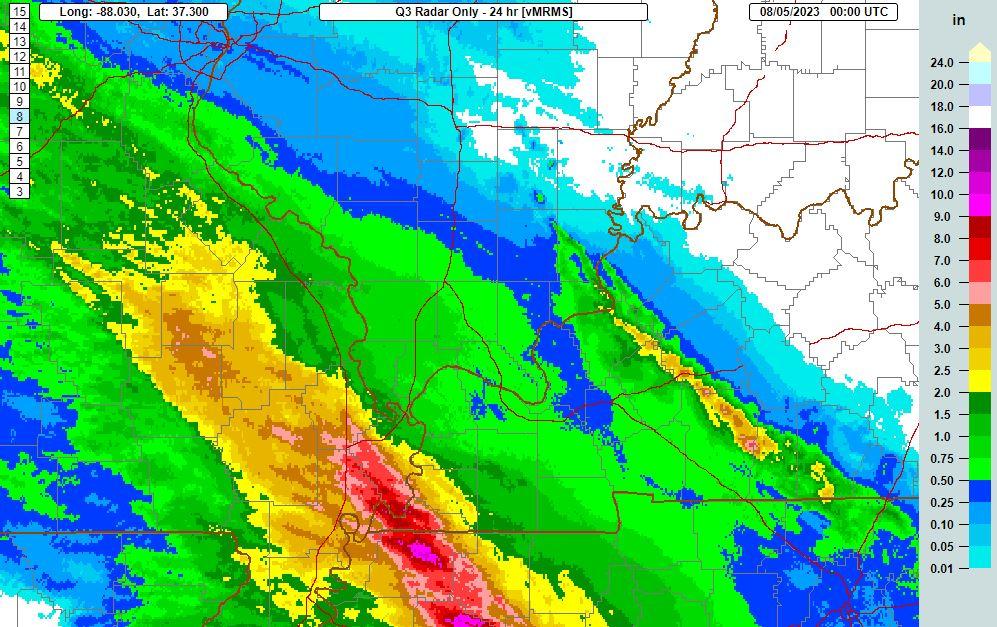
The primary axis of heaviest rain occurred across southeast Missouri into far southwest Kentucky. However, there were secondary narrow bands of heavy rain that occurred to the northeast across portions of southeast Illinois, southwest Indiana, and the southern Pennyrile region of west Kentucky. The corridor of 6 to 12 inches was focused from Bollinger County Missouri southeast into Fulton County Kentucky and northwest Tennessee. The 24 hour images show that the heaviest rain from the 2nd batch occurred roughly over the same area that experienced the heaviest from the 1st batch. The bullseye was displaced further southeast with the 2nd wave though, over Hickman and Union City, as opposed to over Marble Hill and into southern Cape Girardeau County with the initial wave.
The Fulton County Mesonet located 2 miles east of Hickman, KY observed 11.28″ of rain in 33 hours from 3 AM August 3rd through 12 PM August 4th. This broke the previous 2 day rainfall record for Fulton County which was 9.80″ back on January 1-2, 1966. The 1 day record also was shattered, with 9.69″ occurring between 8 AM August 3rd and 8 AM August 4th. The previous 1 day record for the county was 7.24″ set back on September 23, 2006.
24 Hour MRMS rainfall estimates ending at 7 PM August 3rd (graphic below)
Below. 24 Hour MRMS rainfall estimates ending at 7 PM August 4th
The WPC/NOAA issued a rare high risk of flash flooding for this event.
The Forecast – WFO Paducah started mentioning the pattern favored heavy rain/training thunderstorm potential in their AFD’s a week beforehand. We issued a Flash Flood Watch shortly after 1 AM on August 2nd. The initial watch went through Noon on the 3rd but as the signal for a secondary heavy rain event grew, we extended the watch through Noon on the 4th.
As confidence grew that training thunderstorms would produce copious amounts of rainfall, WPC upgraded their excessive rainfall outlooks both on the evening of August 3rd and again on the 4th.
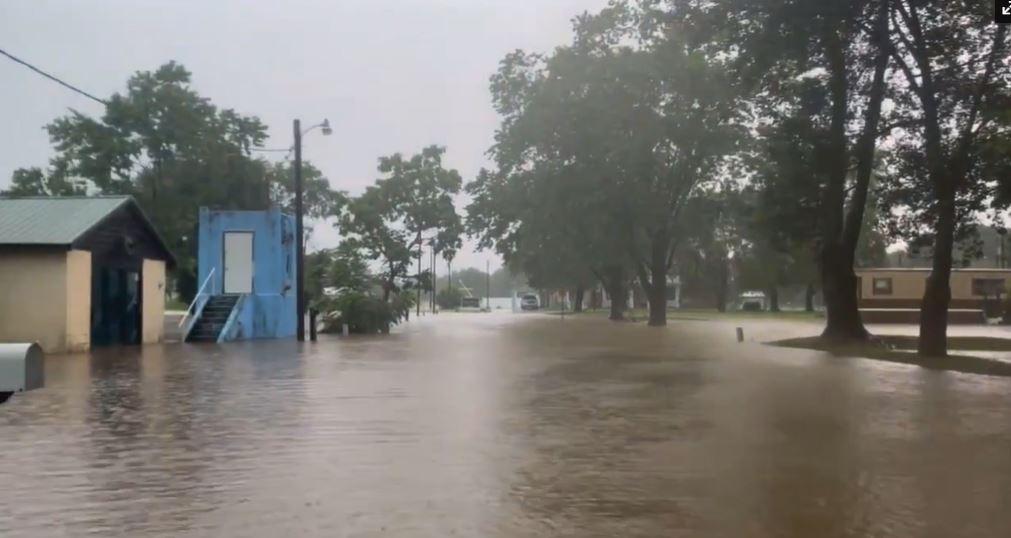
Marble Hill, MO courtesy of Emily Pike
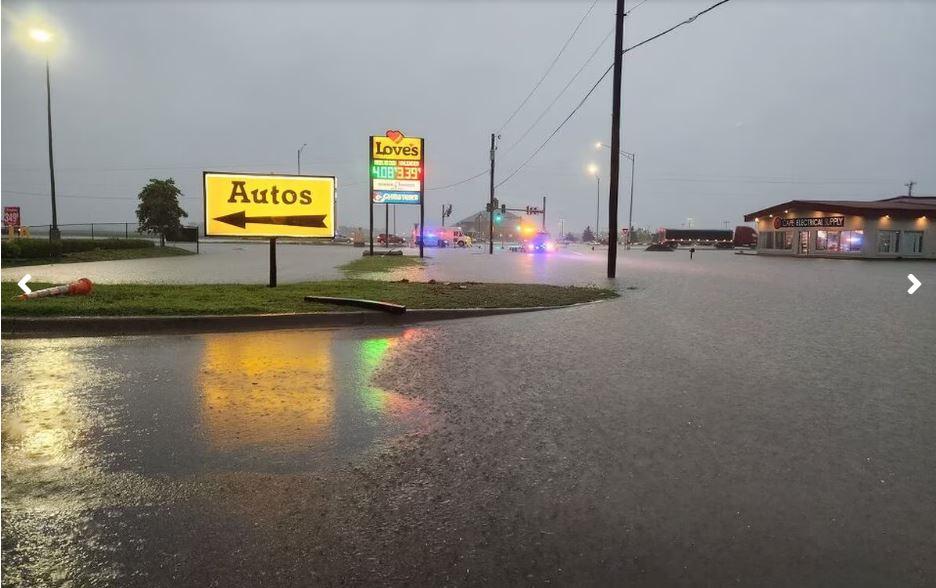
Loves Truck Stop in Sikeston, MO courtesy of Tracy Wilson
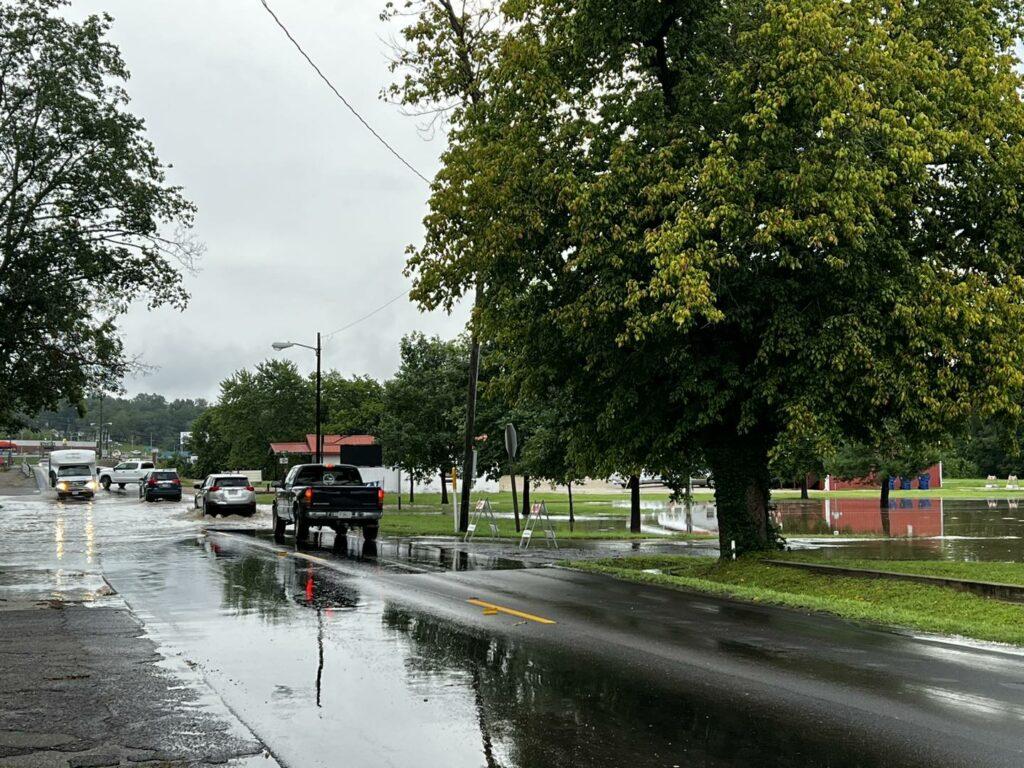
Marble Hill, MO courtesy of City of Marble Hill Facebook page
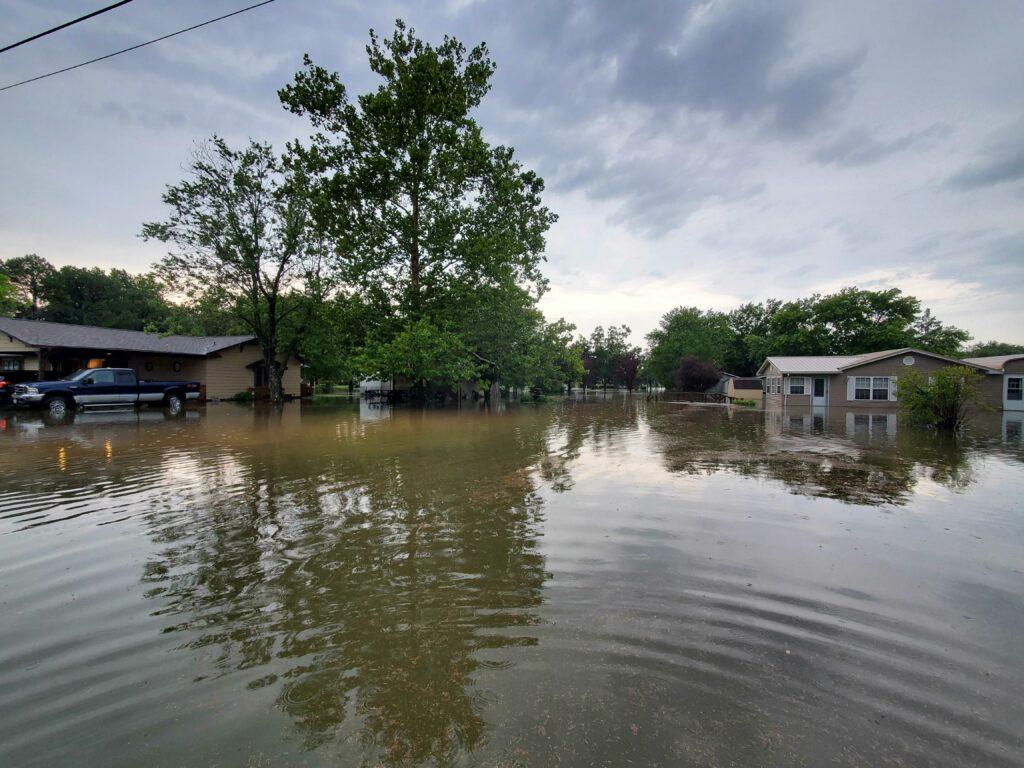
Advance, MO courtesy of Emily Pike
August 20th through Augst 26th. Hot temperatures and record high humidity levels lead to daily heat index readings of 105 to 120.
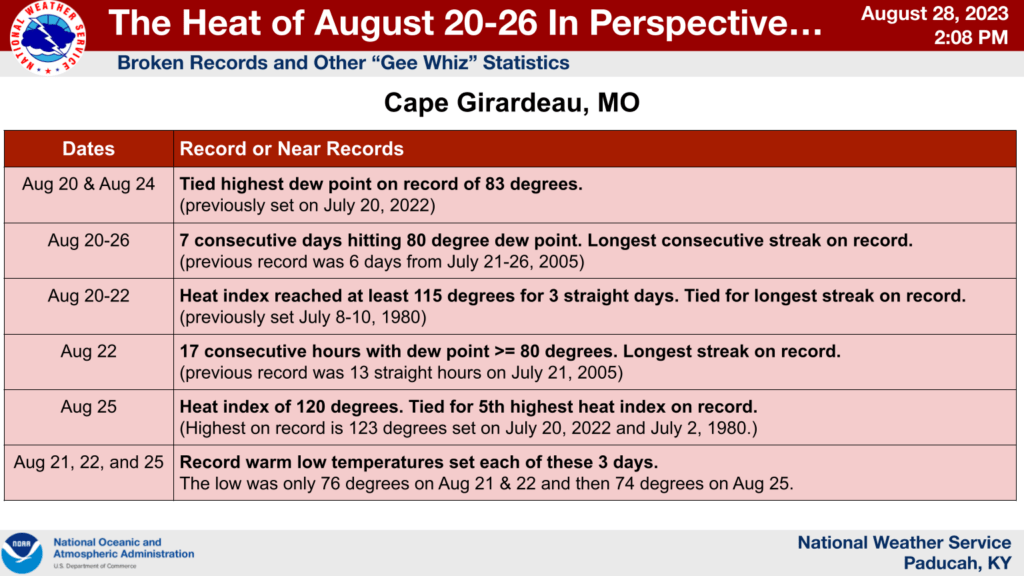
A large ridge of high pressure aloft set up over the center of the country around August 20th and lead to a week-long heatwave across our region. High temperatures were primarily only in the low to mid 90s most days, but the main headline was the extreme humidity levels witnessed over the entirety of this event. Portions of our region experienced very heavy rainfall amounts of 15 to 25 inches from July 1st through mid August. This set the stage for record levels of evapotranspiration from the vegetation and crops. Dew points, a measure of humidity levels, were routinely in the upper 70s to lower 80s, with several locations peaking in the mid 80s. Cape Girardeau and Paducah each tied their highest dew points on record of 83 and 82 degrees respectively. This caused heat index readings to peak between 105 and 120 degrees each day from August 20th through the 25th, and continued across southwest portions of the region on the 26th. The high humidity levels also led to dense fog formation several nights during this event, which was rather unusual for a prolonged heat wave.
Extreme Humidity
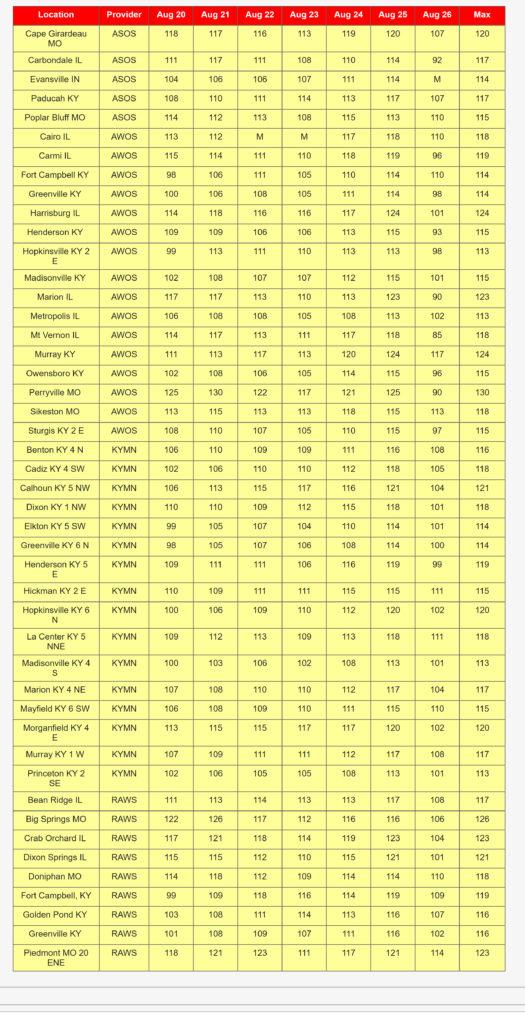
Some of the highest dew points on record were observed across our region during this heatwave. Most locations reached 80 degrees at least once, and several locations reached this level for 7 consecutive days! Dew point temperature is a measure of humidity, with values greater than 75 degrees typically referred to as oppressive. The looping image below shows the highest dew point observed across our region each day from August 20th through the 26th. Further down, you will see a table with the highest values observed each day at select locations. The highest reading was 86 degrees in Perryville, MO and the McLean County Kentucky Mesonet site near Calhoun.

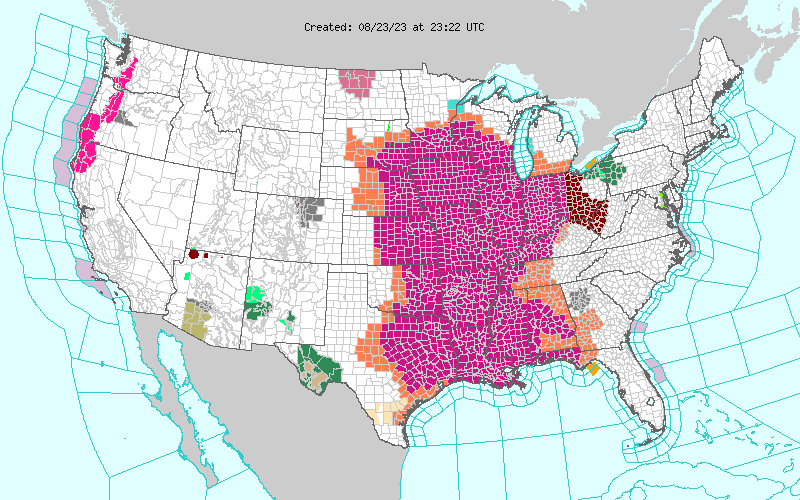
Map showing all of the National Weather Service Watches, Warnings, and Advisories that were in effect the afternoon of Wednesday, August 23rd. The magenta color across much of the central part of the country shows where the Excessive Heat Warnings were in effect on this date.
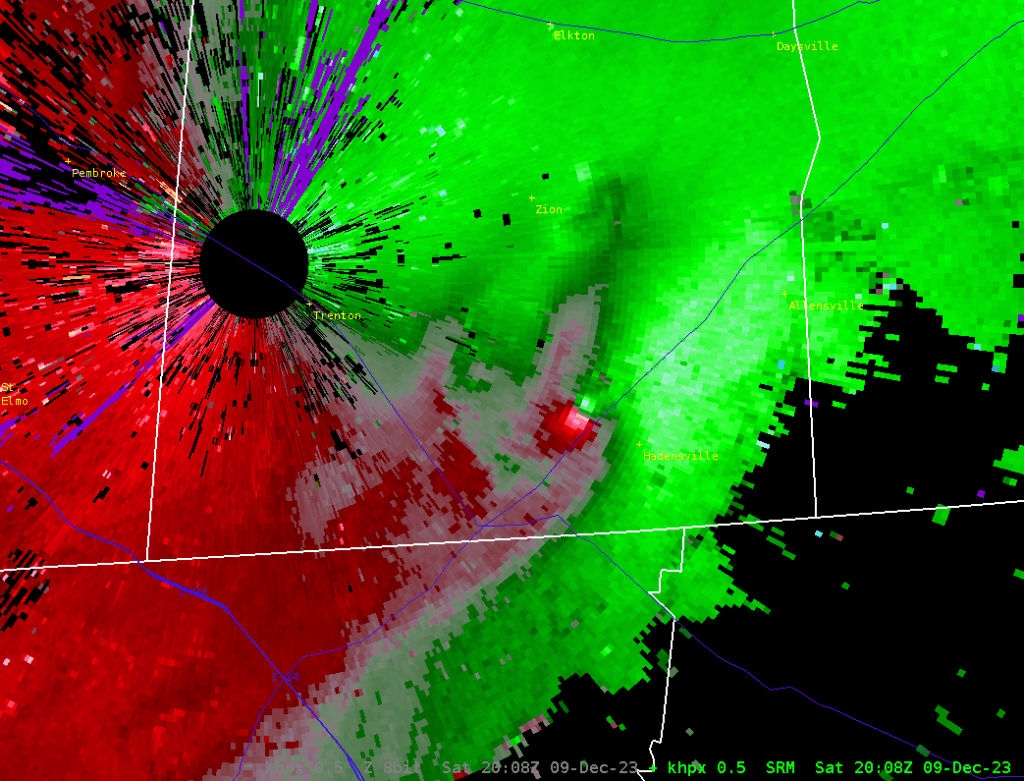
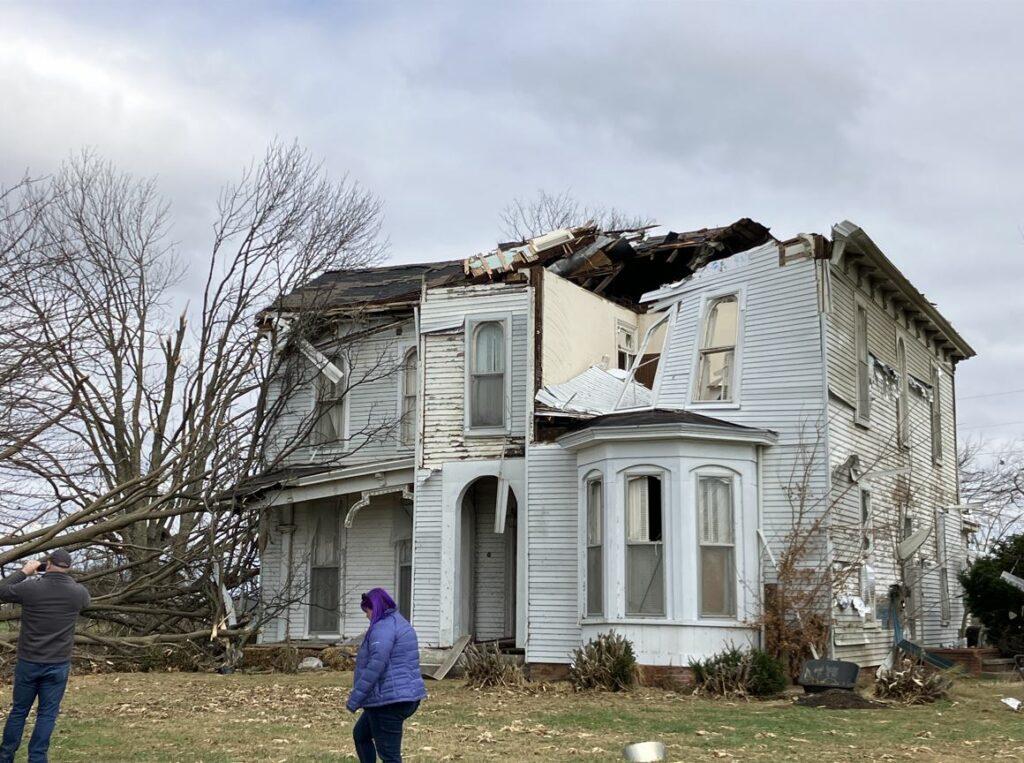
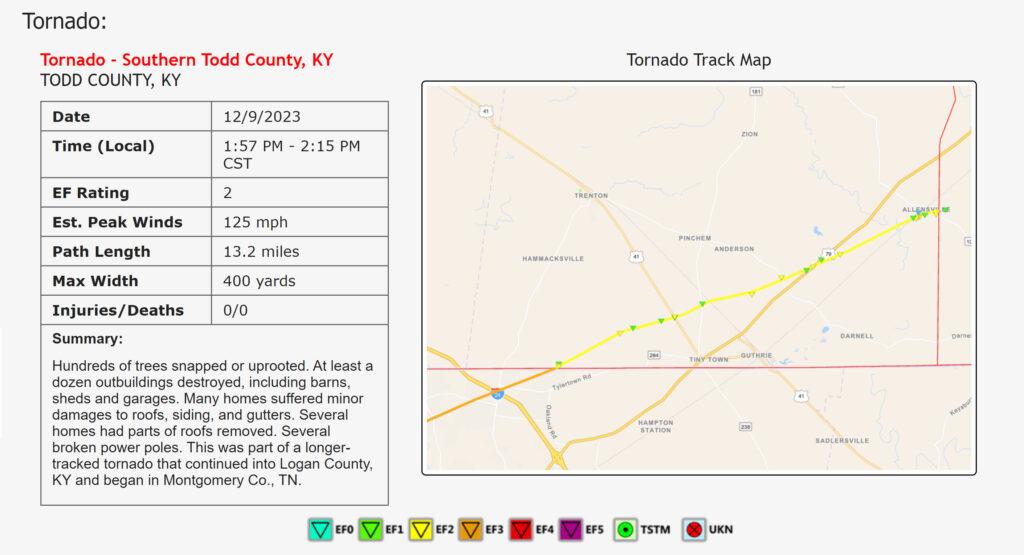
December 9, 2023. EF-2 tornado in southern Todd County, Kentucky. Part of 47.75-mile-long path with EF-3 damage in Clarksville, TN.
Clusters of thunderstorms developed by mid morning across northeast Arkansas and the Missouri Bootheel. They lifted northeast across west Kentucky and Tennessee during the late morning and into the afternoon. A few of these storms became severe across west Kentucky. The prominent storm moved from Clarksville, TN into southern Todd County around 2 PM before moving into Logan County. NWS Damage surveys confirmed that an EF-2 tornado touched down in Todd County. Damage was rated EF-3 just south of our border in the Clarksville, TN area. This tornado was on the ground for approximately 48 miles, 13 of which were in our forecast area.
Damage in southern Todd County courtesy of NWS Storm Survey
Radar of the tornado