Posted by Meteorologist Beau Dodson
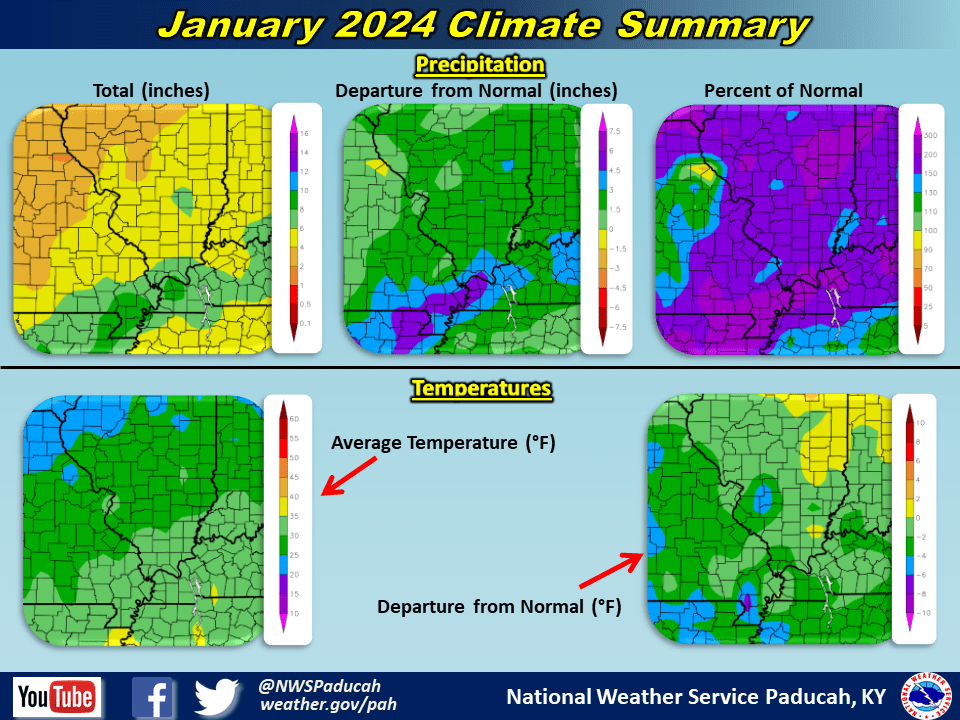
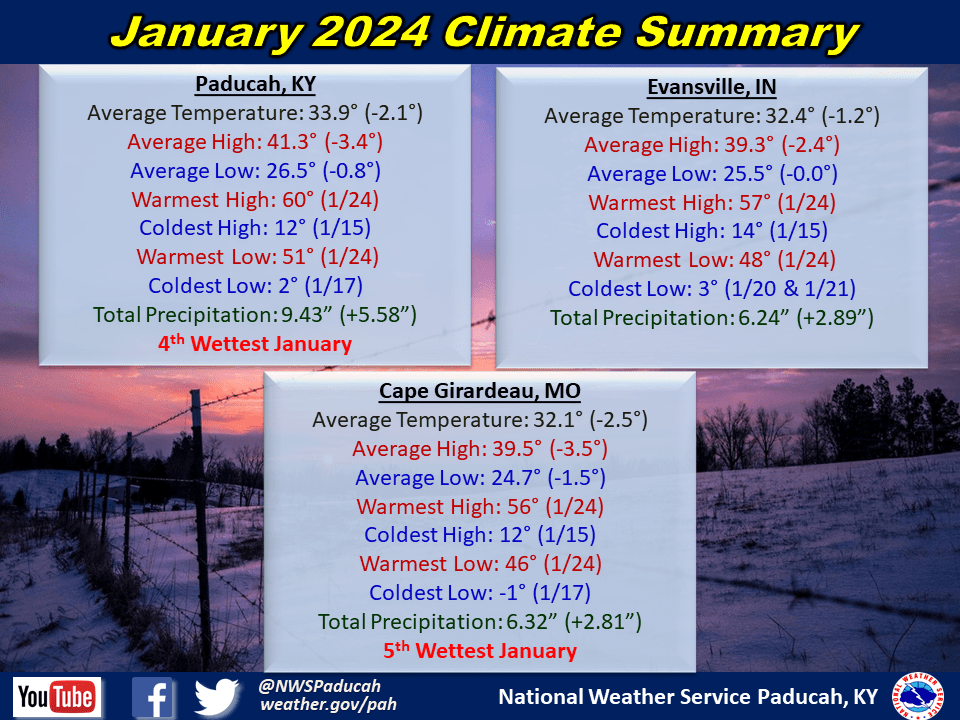
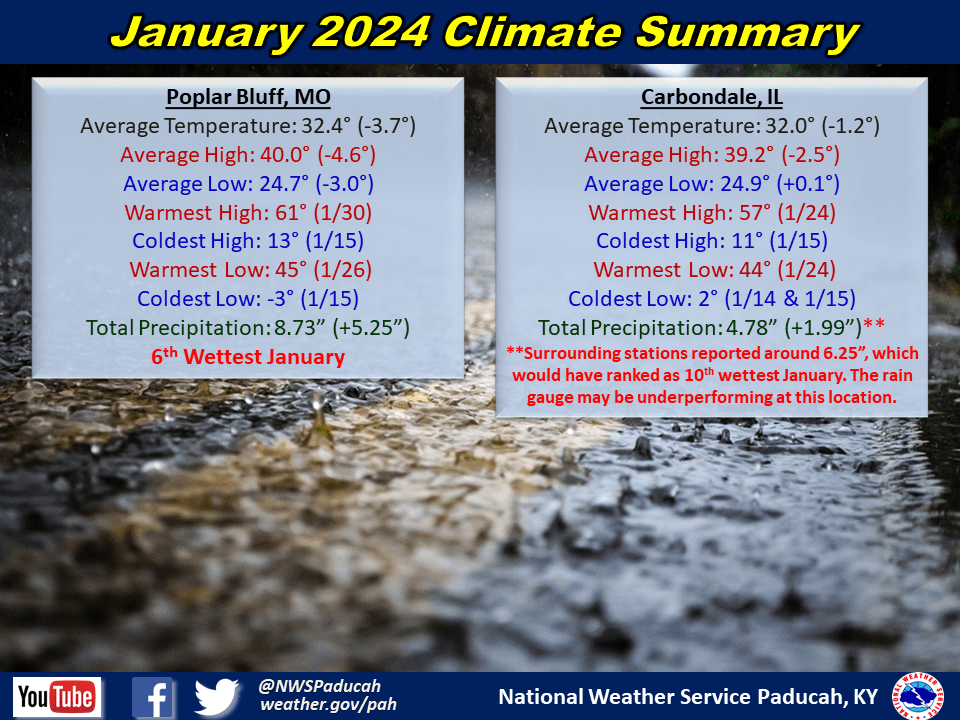
PADUCAH, KENTUCKY (NewsFirst) — Temperatures were below normal by around 1 to 3 degrees. The first 5 days of the month were slightly below normal, generally in the low to mid 40s for highs and 20s for lows. A warmer period followed from the 6th through the 12th with many days in the upper 40s or 50s for highs and several nights above freezing for lows. A brutal blast of arctic air followed from the 13th through 21st. The coldest conditions were observed from the 14th through the morning of the 17th with temperatures 15 to 30 degrees below normal. Highs were only in the teens for much of this time with lows in the single digits. Wind chills fell well below 0, with the coldest being -19 degrees in Mount Vernon, IL and Perryville, MO. Several locations failed to rise above freezing for 8 or 9 consecutive days, including Paducah. The frigid airmass finally eased up leading to a warmer period from the 22nd through 26th. Most locations reached the 50s several of these days and a few locations even touched 60 degrees on the 24th. Somewhat cooler weather was observed from the 27th through 31st with highs generally in the 40s to lower 50s, which was still slightly above normal.
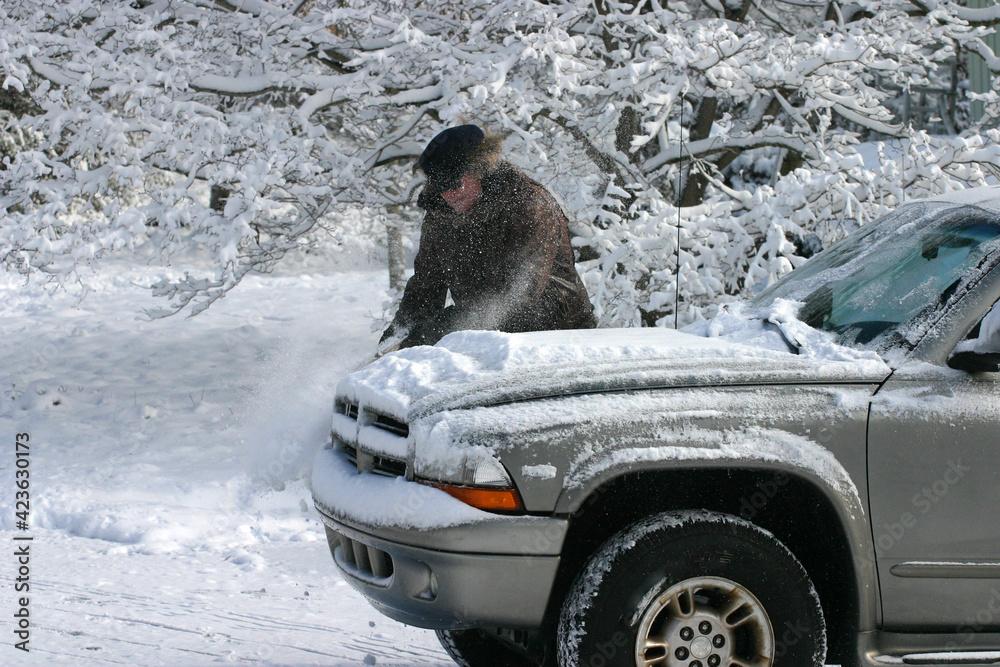
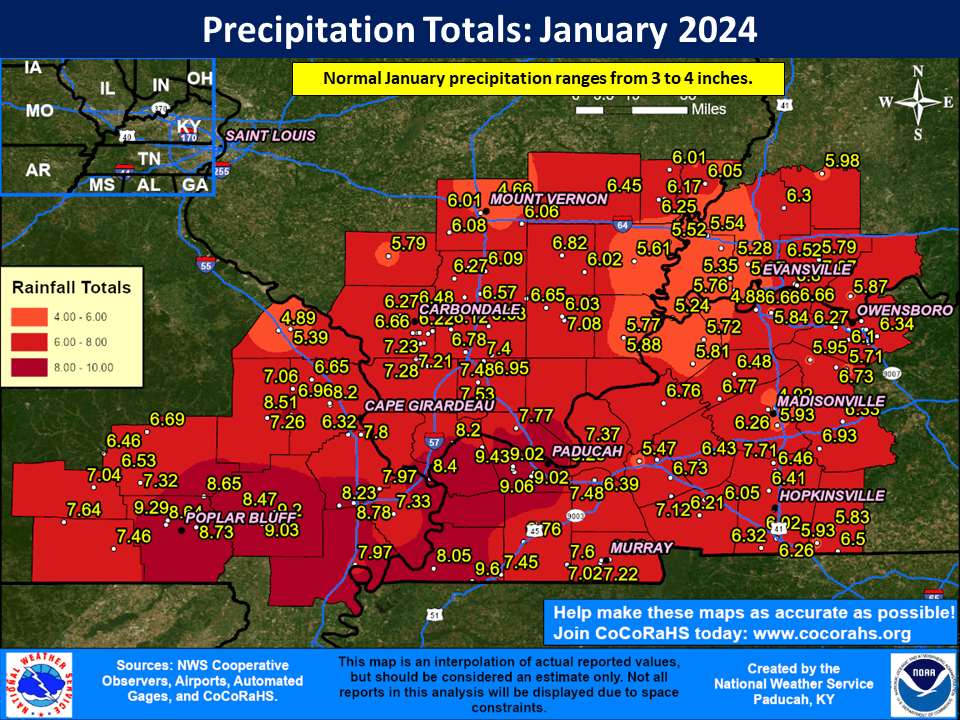
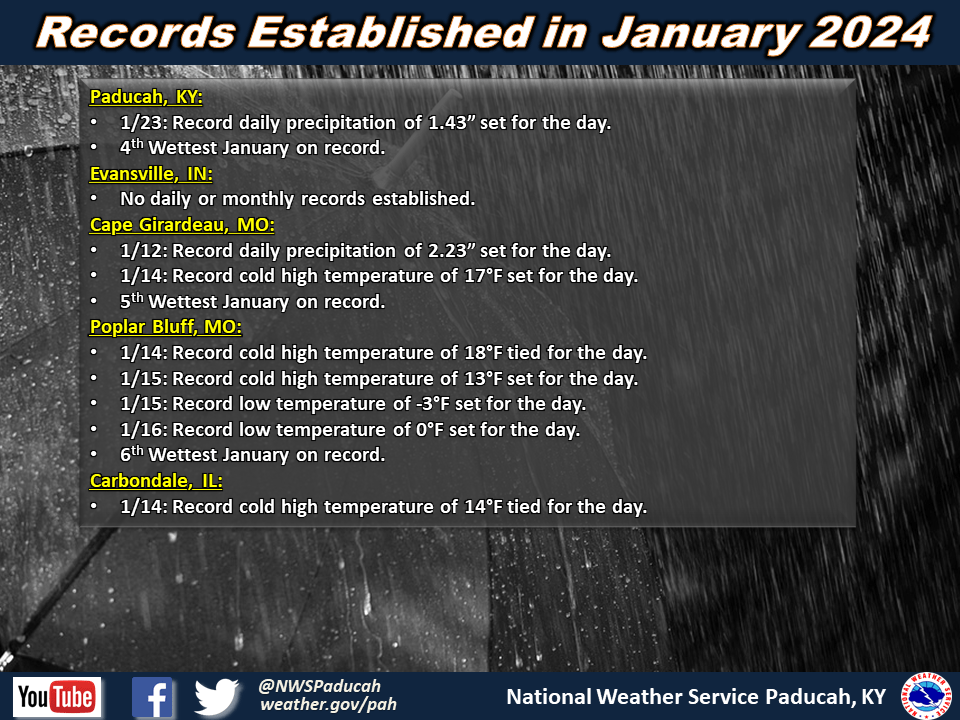
Precipitation finished wetter than normal across the region. Amounts ranged from 5 to 9 inches, which was anywhere from 2 to 6 inches above normal (or 150-250% of normal). Paducah registered our 4th wettest January on record, while Cape Girardeau and Poplar Bluff finished as their 5th and 6th wettest respectively. The highest observed amount in our forecast area was 9.60” at a CoCoRaHS station 5 miles west of Fulton, Kentucky (Hickman County). Our first measurable snow of the winter season occurred on the 14th and 15th, with amounts of 1 to 3 inches for most of the region. Another little snow event on the 19th produced a dusting to an inch in a few locations. Due to the frigid temperatures in place, the snow remained on the ground for a solid week, with Paducah officially registering a snow depth of at least a trace for 8 consecutive days.
The graphic below is an interpolated monthly rainfall map using actual observations. Please note that there are likely discrepancies in between observations, since the values are estimated based on nearest reports.
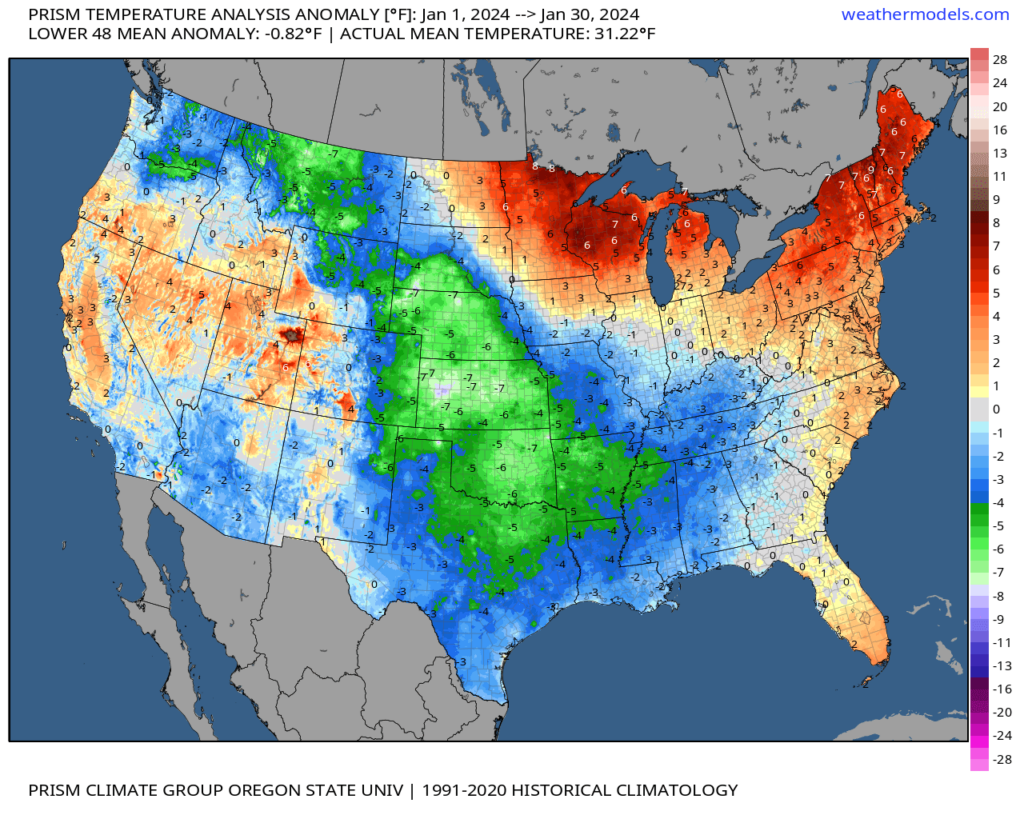
It was cold on a national level, as well. Here was the January temperature anomaly map. How many degrees above or below average were temperatures.