Posted by Meteorologist Beau Dodson
Want to receive more weather information? I provide a service through www.weathertalk.com
Subscribe at www.weathertalk.com and then download the Beau Dodson Weather app from the app stores!
Apple users: Beau Dodson Weather App
https://wtalk.co/9EZYG8A8
Android users: Beau Dodson Weather App
https://wtalk.co/ZEWYU8ME
Need help? Email me at beaudodson@usawx.com
* Daily weather forecasts
* My personal weather blog with all sorts of weather information!
* Special weather statements sent to the Beau Dodson Weather app.
* Rapid fire tornado alerts.
* Severe weather alerts and forecasts.
* Severe weather updates throughout the day (when severe weather is occurring)
* Ice storm alerts and forecasts.
* Winter storm alerts and forecasts.
* Winter storm updates throughout the event.
* Regional weather videos.
* Long range weather videos.
* A daily forecast that I hand type for your county. Sent out every afternoon.
* Long range outlooks. Including week one, two, three, four, and monthly outlooks. Seasonal outlooks.
* App messages to alert you when I have updated the weather blogs and Facebook.
* And more!
This post is going to concentrate on Christmas weekend into the week of Christmas. For weeks now, we have been forecasting an active weather pattern during this timeframe.
We are now drawing into the short-range portion of the forecast. Confidence in the forecast is increasing.
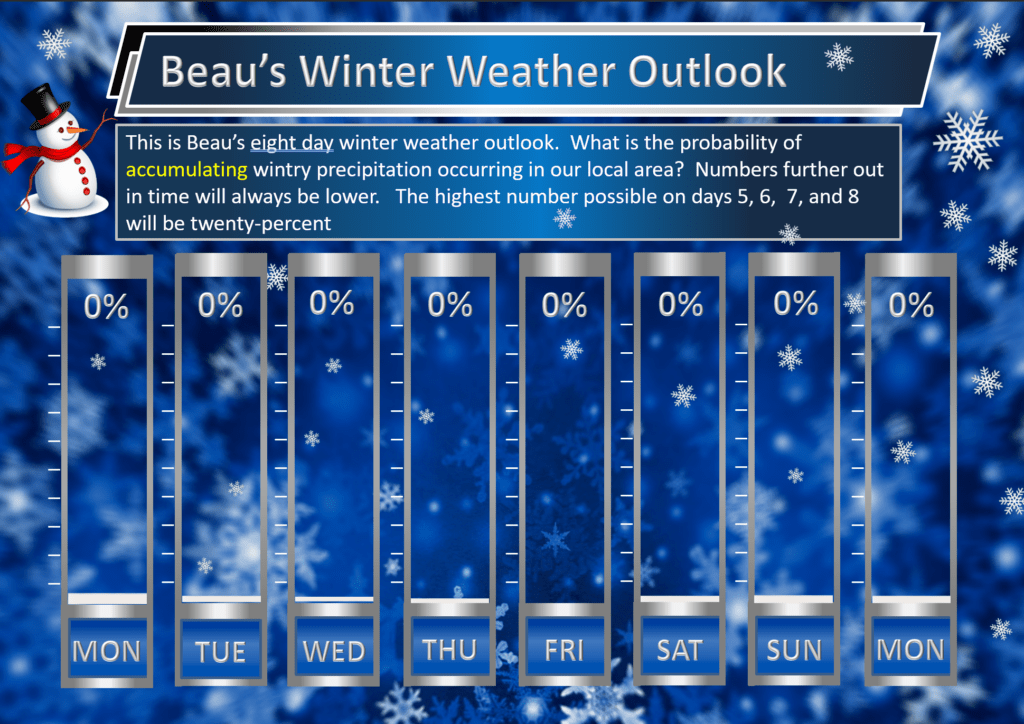
Those dreaming of a white Christmas will just have to keep dreaming. It just isn’t in the cards this year. I do not see path to snow.
It would take significant changes to the overall weather pattern for us to have snow on Christmas. The chances of that happening are now less than five percent.

All signs point to above average temperatures Christmas Day. All signs point to damp weather.
Let me show you some maps.
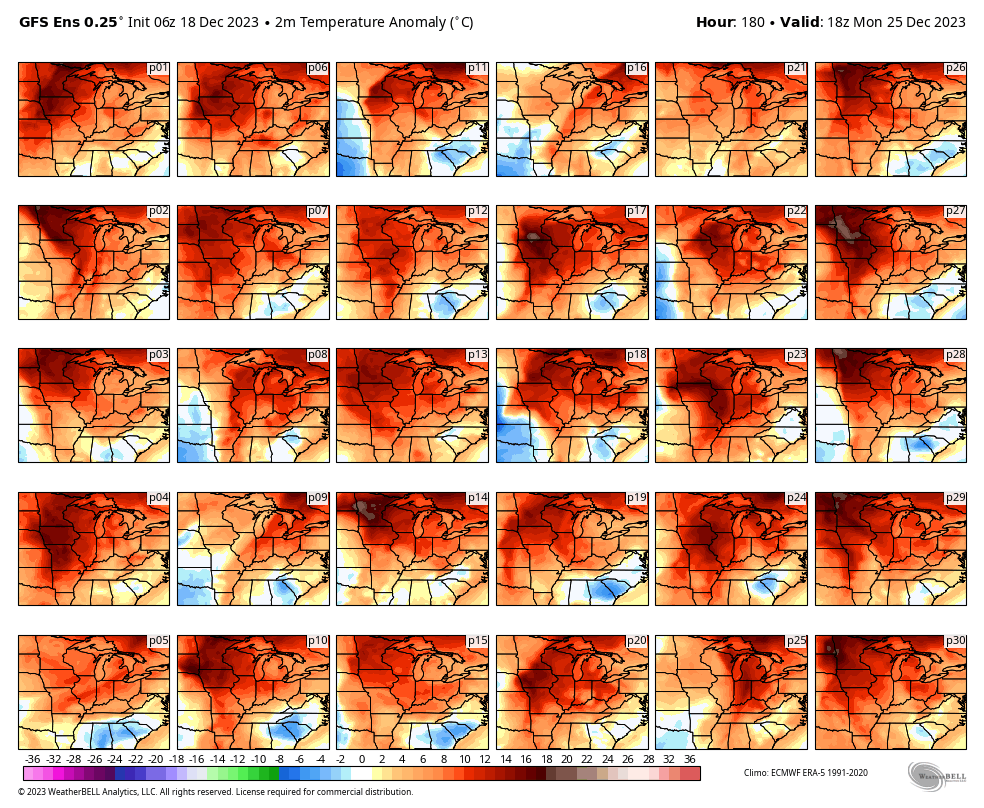
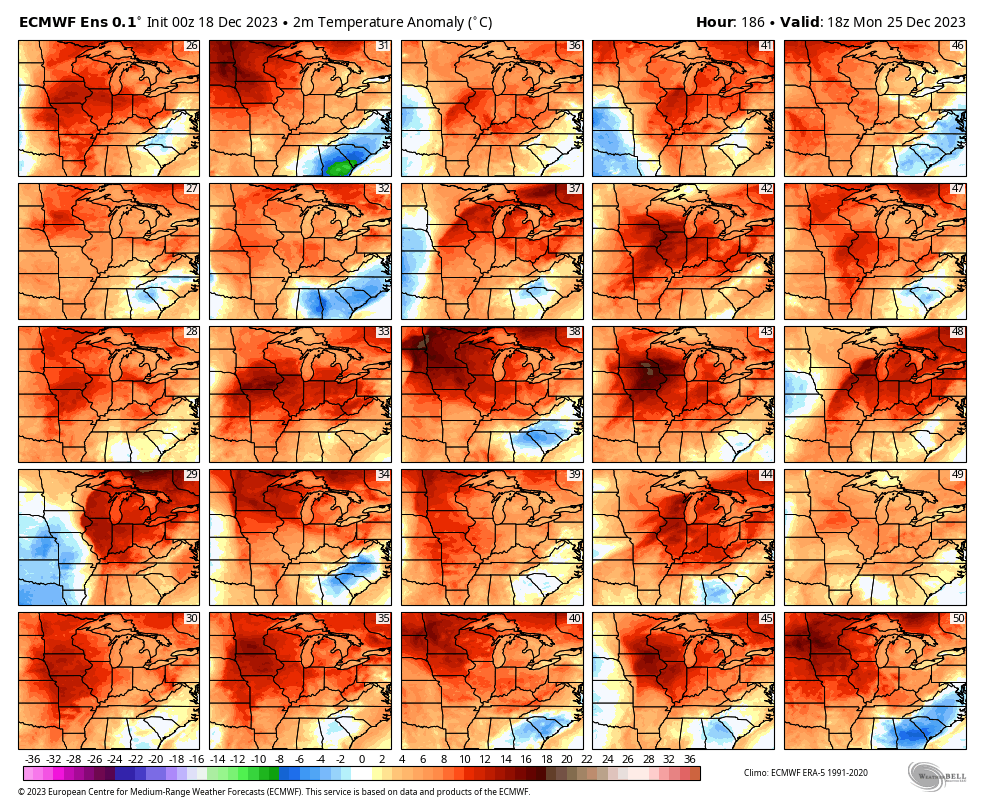
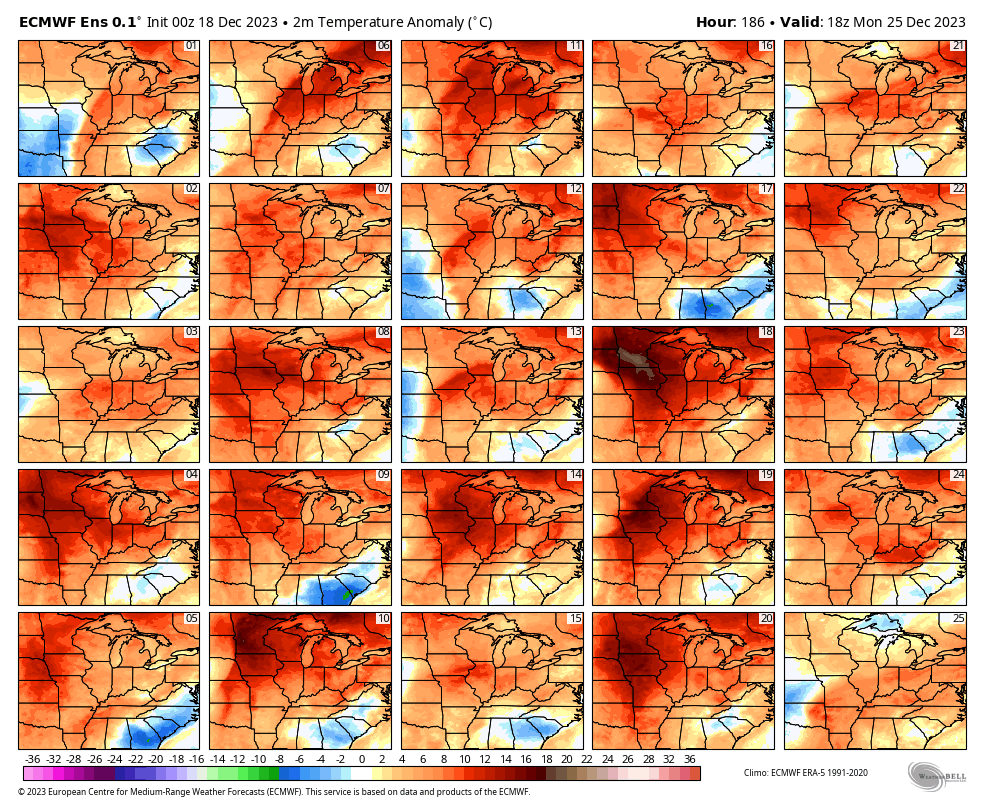
These are model ensembles. Ensembles are the same model ran over and over again with slightly different beginning variables. You want to look for squares that match. The more that match, the higher the confidence in the overall forecast.
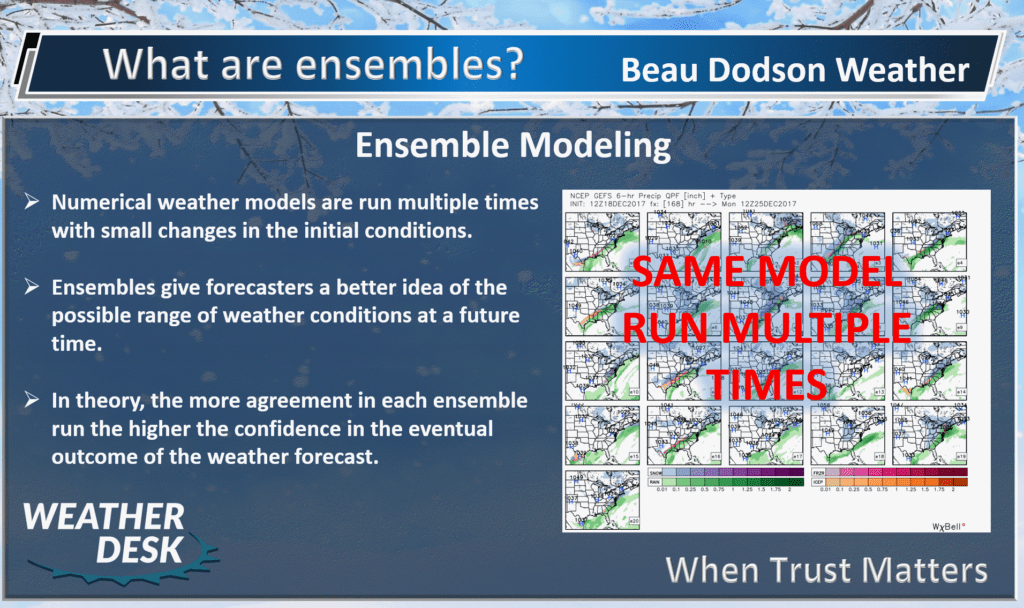
As you can see, almost all of the squares below agree. Above average temperatures will be the general rule.
Orange and red colors represent above average temperatures.
Average high temperatures at Christmas are around 45 degrees. Average low temperatures are around 29 degrees.
At this time, I am forecasting highs in the 50s for Christmas Eve and Christmas Day. Confidence in the forecast is 60%.
Here is the latest temperature forecast for December 23rd through the 27th. When averaged together, temperatures are very likely to be above average (near certain).
The deep red color is a high probability of temperatures being above seasonal averages.
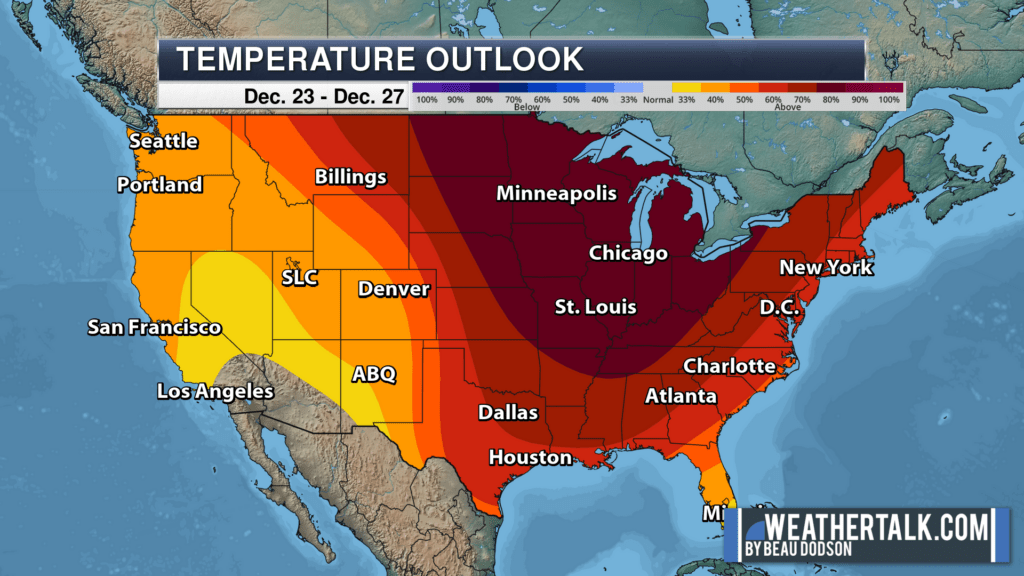
That covers the temperature portion of the forecast.
What about precipitation?
Data points to scattered showers this coming Thursday night into December 27th. Several rounds of light to moderate precipitation.
I will need to fine tune each days forecast as we draw closer to the time period. Actual rain probabilities will vary each day and night.
For now, I have 30% to 40% rain chances Thursday night into Sunday. There will likely be time periods where I bump that up to 60%.
We have struggled lately with rainfall forecasts. Not going to lie, I have not been happy with the forecast numbers. It seems each event produces less rainfall than forecast. Perhaps not everywhere, but for many.
We have done well forecasting rain. We just have not been getting the totals exact.
Occasionally, drought conditions can skew rainfall forecasts. This happens more in the summer than winter, but it could be part of the issue.
At this time, rainfall totals Thursday into Sunday are shaping up to be in the 0.10″ to 0.50″ range. I will need to monitor this portion of the forecast and update it moving forward.
It is still a bit too early to forecast rainfall totals for the December 25th through December 28th timeframe.
Let me show you the GFS model for this Thursday into Christmas Eve. Green represents rain showers. Timestamp upper left. It is in Zulu time. 12z=6 am. 00z=6 pm.
This is the future-cast radar. What radar might look like later this week.
You can see rain showers developing Thursday night and lingering on and off into Christmas Eve. Nothing too crazy, but enough to be a nuisance. Umbrella and jacket weather.
Then, the next question is Christmas Day.
Christmas Forecast
There remain differences in the data as far as rain probabilities and intensity. At times, the models want to develop a mature cyclone. A mature storm system.
If that were to happen, then we would need to increase the rainfall totals Christmas Day into Christmas night (perhaps into the day after).
I am monitoring thunderstorm chances. For now, that appears to be a limited risk. If the low is stronger/deeper and tracks to our northwest, then we will have to revisit the thunderstorm portion of the forecast.
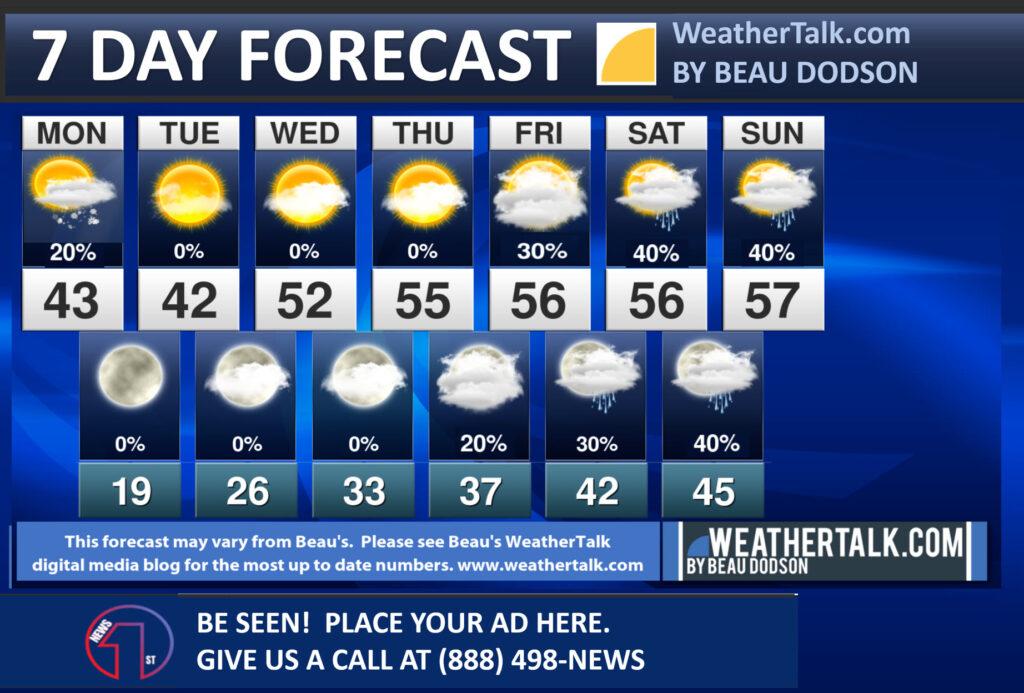
For now, I have a 60% chance of rain Christmas Day into December 26th. Highs in the 50s. Lows in the 40s. Gusty winds.
Keep in mind, there is disagreement on the timing of the Christmas storm system.
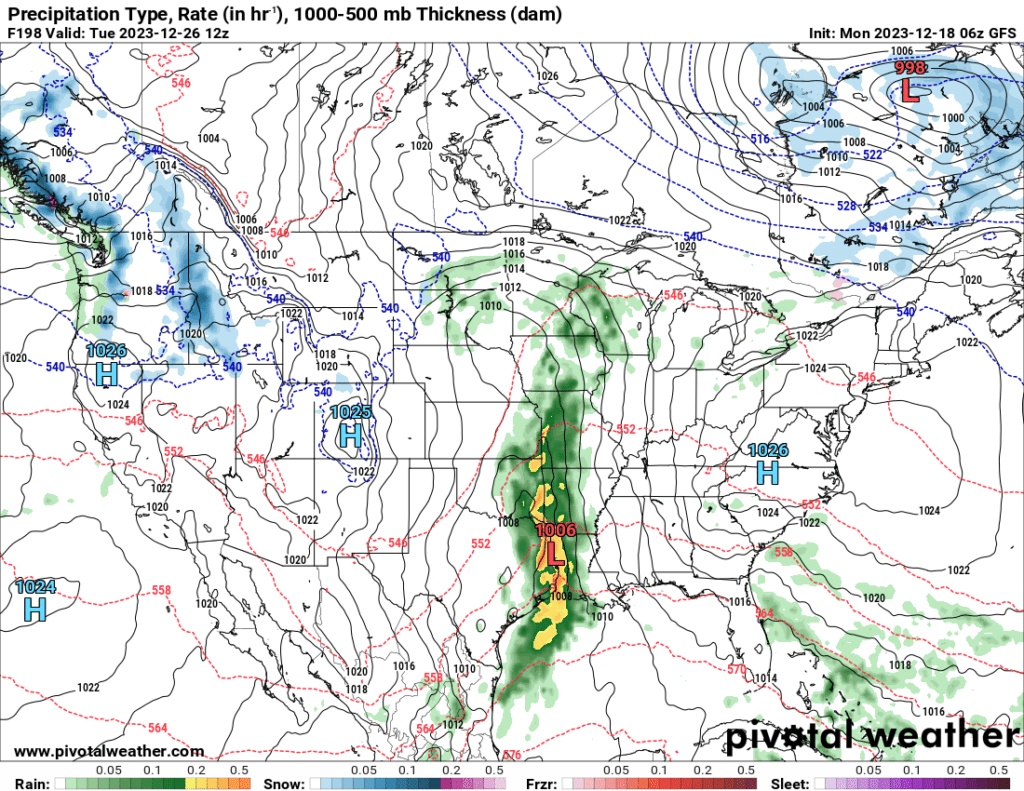
Let me show you the GFS model’s idea. This is the weather map the morning of December 26th. The GFS has the rain to our southwest. This would leave Christmas Day dry. That would mean the rain arrives Tuesday and Wednesday vs Monday.
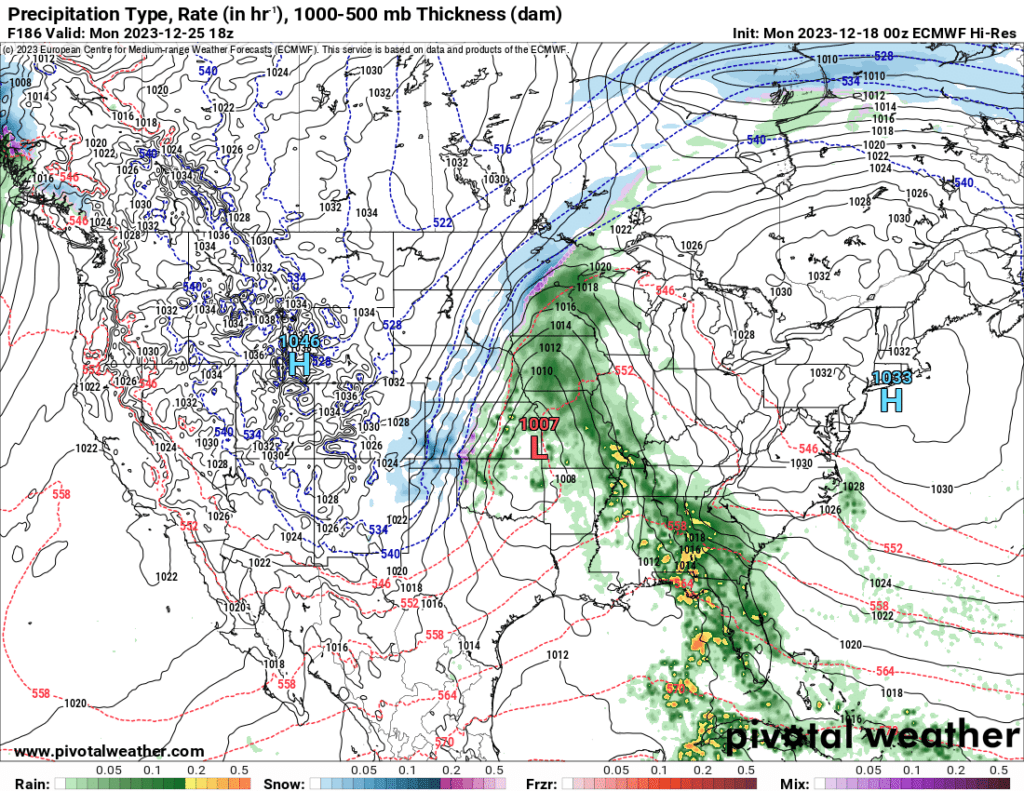
The EC model, on the other hand, has rain arriving Christmas Day.
It shows widespread rain the region Christmas morning and afternoon. Perhaps even a rumble of thunder.
I will need to keep an eye on the timing of the systems. Monitor updates.
Severe weather?
When forecasting severe weather, I look for dew points in the upper 50s and 60s (generally).
Dew points are a measure of moisture. Thunderstorms feed on higher dew points.
For now, both models keep the higher dew points to our south. I will monitor this over the coming days. Again, if the system comes in stronger, then we will have to revisit the thunderstorm portion of the forecast.
The pattern will remain active after Christmas into the first week of January. I am tracking a few systems after December 25th.
The bigger question remains cold air. Can we find any cold air to support snow in the forecast.
I keep searching for a pattern shift but keep coming up empty handed.

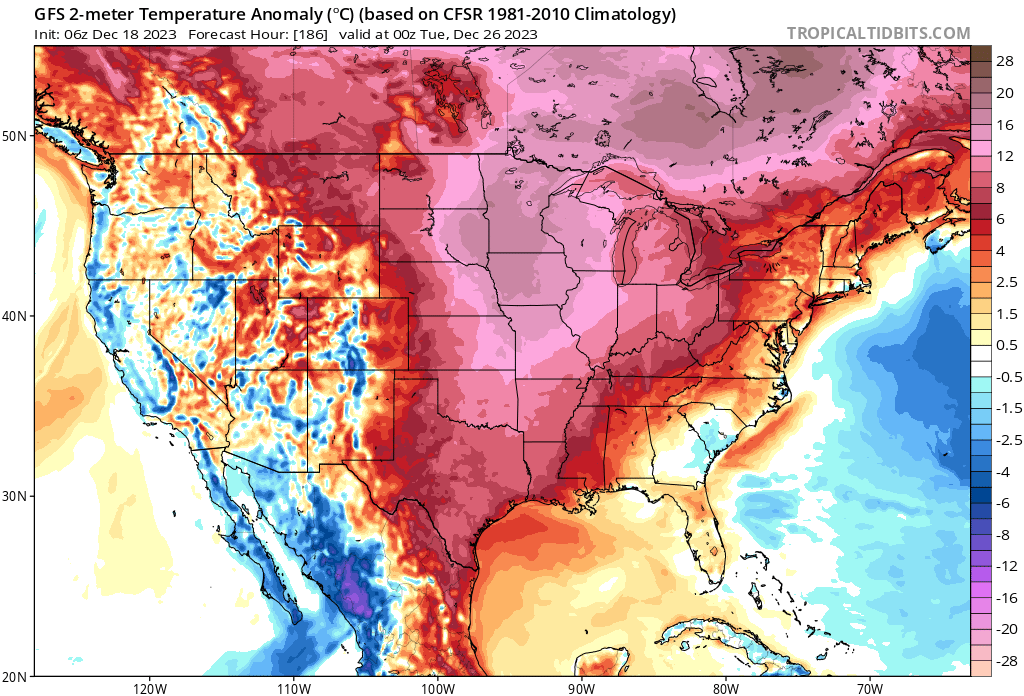
The GFS shows a mild Christmas. This is the temperature anomaly forecast for Christmas Day. Sea of red!
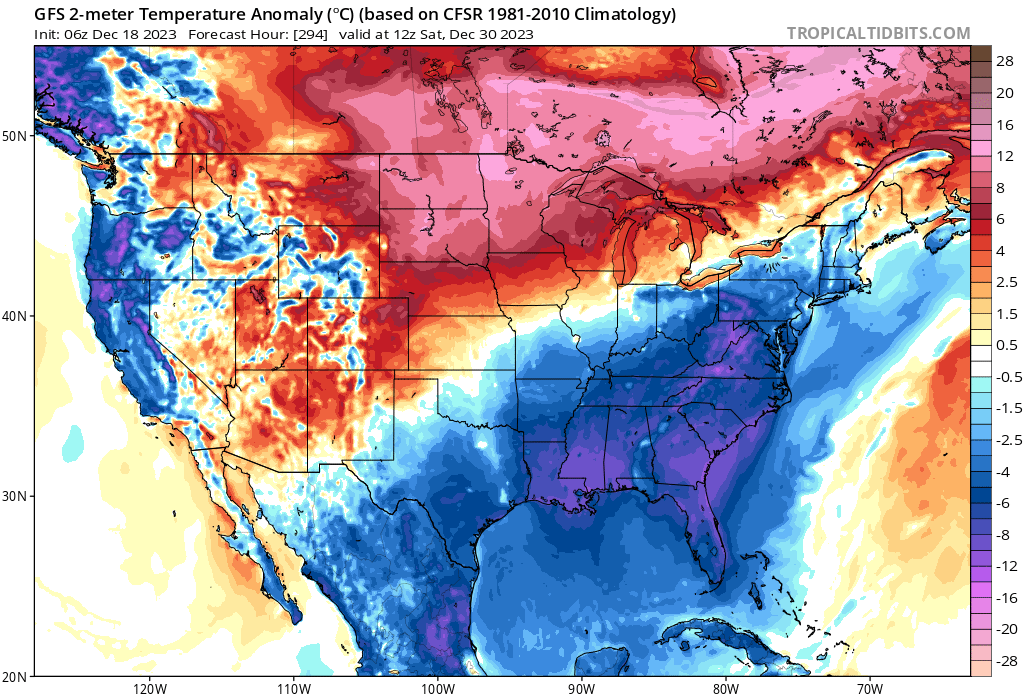
It does have some blue (colder air) around December 29th/30th and the first few days of January.
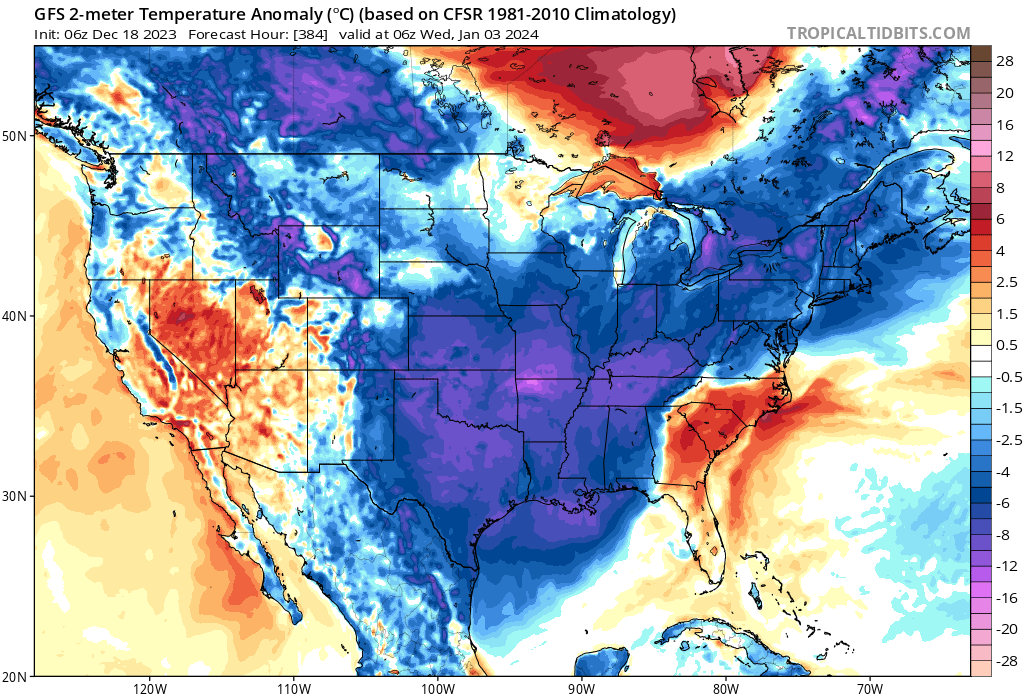
Again, around January 2nd and 3rd.
The December forecast was for above average temperatures across the nation. As a matter of fact, our official forecast was for a top 5 warmest December’s nationwide.
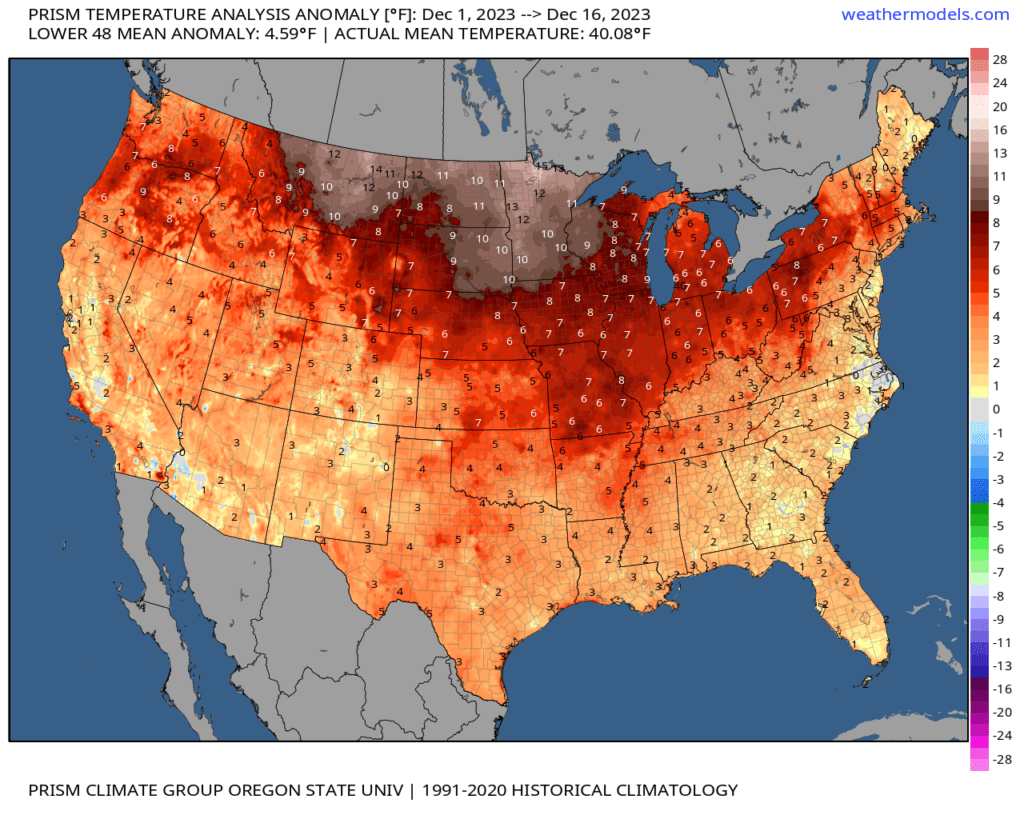
Let’s check in on where we are at with that. Here are the December 1st through December 16th temperature anomalies. Look at the sea of red. The entire nation has been warmer, thus far.
The northern states are WELL above average. Anomalies of 10+ degrees are rare for a 16-day time period.
El Nino remains strong. This is impacting our weather.
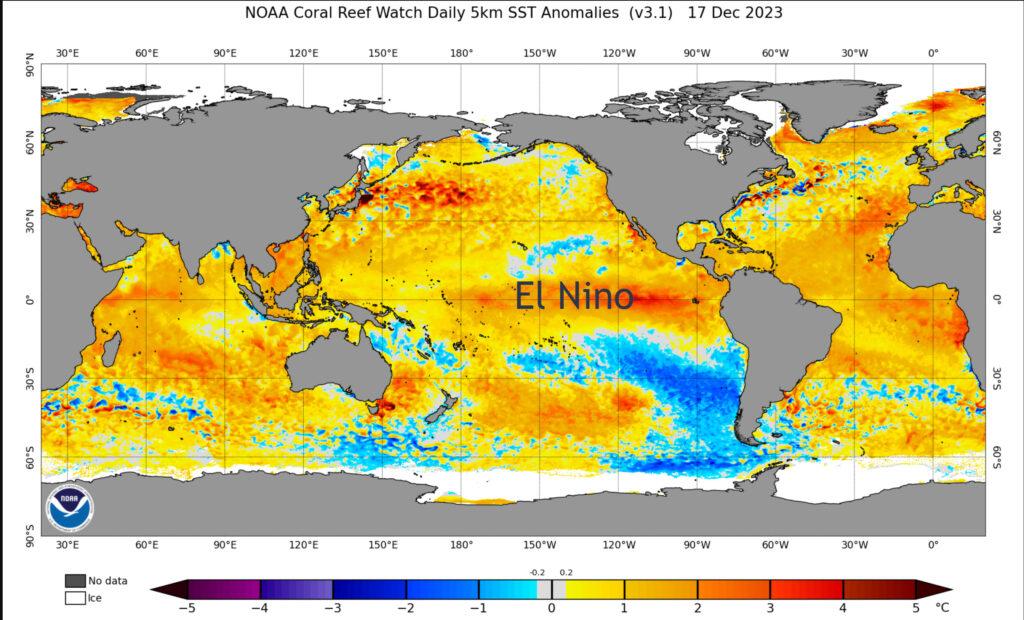
A recent forecast update shows an increased likelihood of this El Niño being historically strong.
While sea surface temperatures were above average across much of the Pacific Ocean in November, many of those elevated temperatures slightly cooled at the start of this month, according to the National Oceanic and Atmospheric Administration.
Despite that, the most recent International Research Institute “plume favors El Niño to continue through the Northern Hemisphere winter 2023-24.”
Based on the latest forecasts, there’s a 54% this El Niño could be “historically strong.”
“An event of this strength would potentially be in the top five of El Niño events since 1950,” the NOAA reported.
El Nino is one reason the nation is so warm.
What about snow?

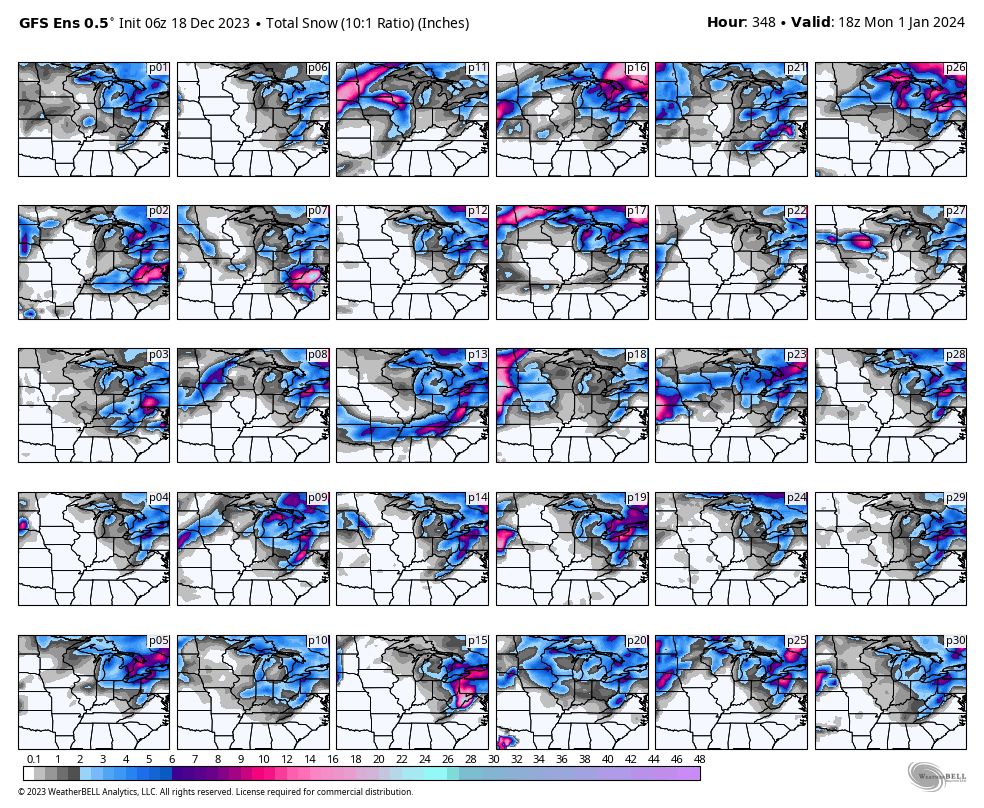
Again, let’s go to the ensembles.
This is the GFS model ensembles. Remember, we are looking for squares to look similar to other squares. The more squares that agree, the higher the confidence in the forecast.
This takes us through January 1st. A few of the squares do show accumulating snow. The majority, however, do not. Let’s keep an eye on this as we move through the next two weeks.
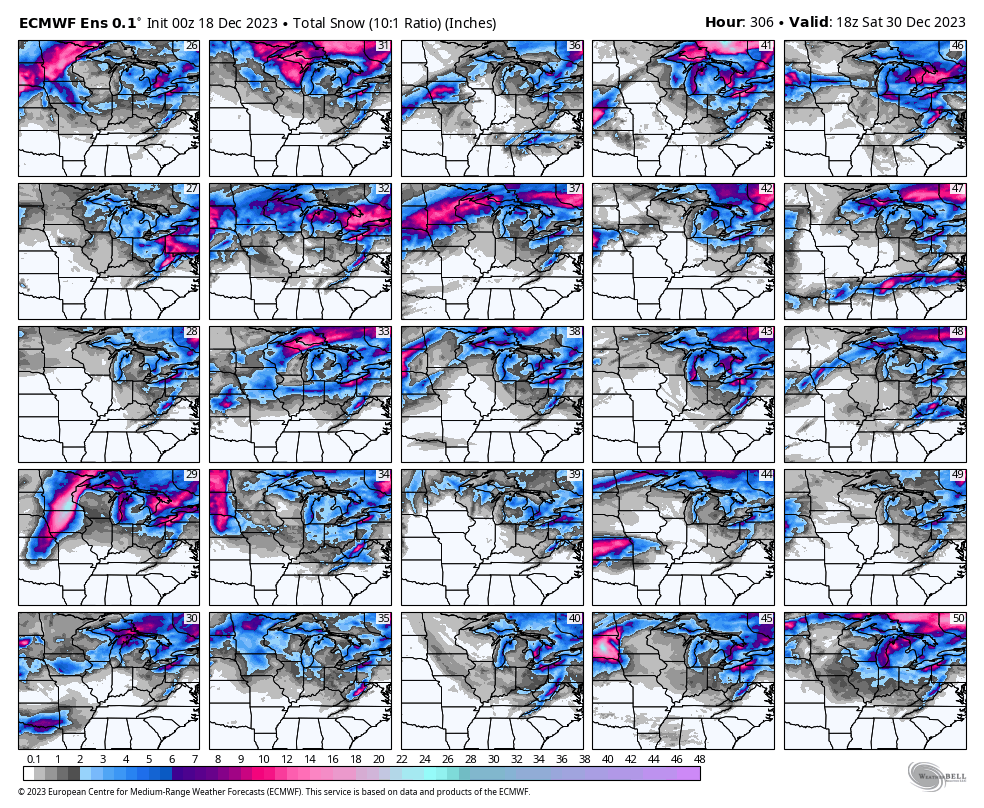
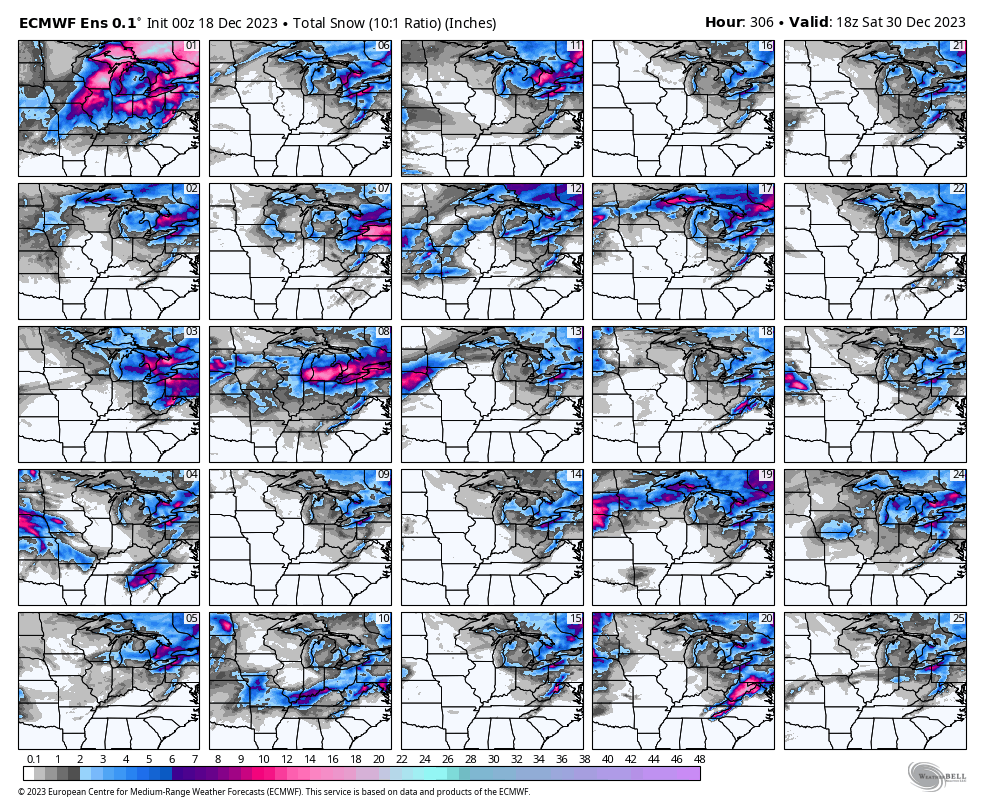
Here are the EC ensembles through December 30th. This is showing you where snow might accumulate.
Once again, there are a few squares show accumulating snow, but most do not.
Don’t give up snow lovers. These maps can change! Snow is difficult to forecast 24 hours in advance, let alone a week or two.
There are several systems to watch after Christmas.
I do not like to post model graphics past a few days. They tend to be chaotic after day five or six. But, I know some of you are wanting snow.
Just keep in mind, there is little or no confidence in the forecast past day seven.
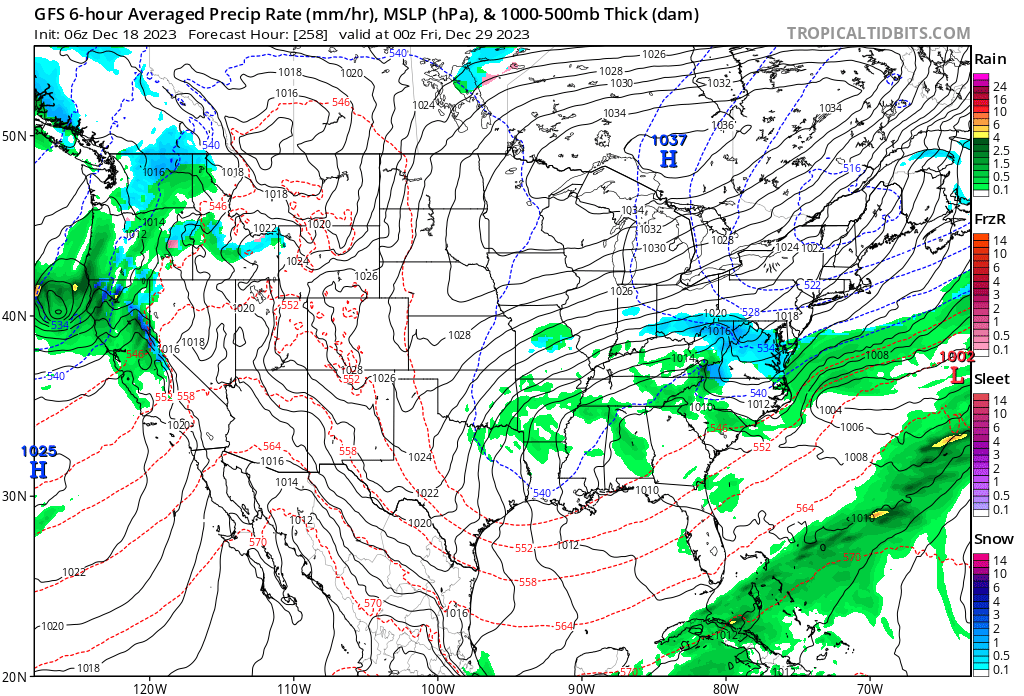
The GFS shows a system around December 29th. It does have a bit of cold air to work with. This is in the ultra-long range so confidence in anything past day seven is very low.
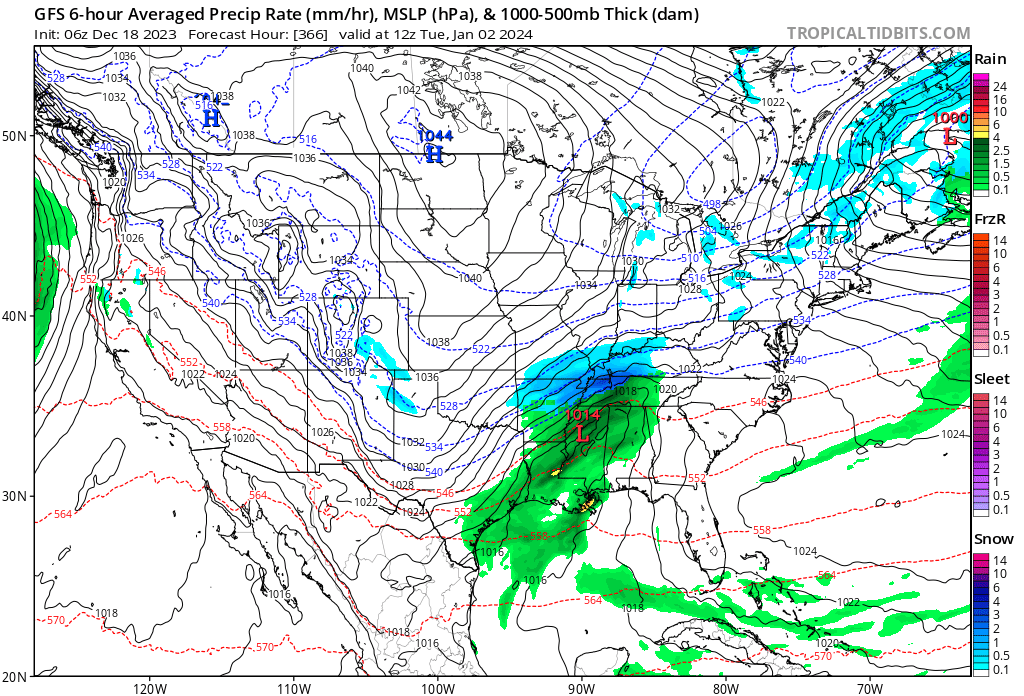
The GFS shows another system around January 2nd. Again, this is so far out that there is no confidence in what it is showing.
Blue is snow. That would be a major snowstorm in our region! But again, this is way way out there in time. I would not get my hopes up. But, we can watch it over the coming days!
If you are wanting snow, then perhaps this will give us something to monitor over the coming days. I am grasping at straws for team snow.
Rain, snow, or sunshine I hope everyone has a wonderful and magical Christmas season.
Let’s remember those who have lost loved ones over the past year or may have to be alone at Christmas.