Posted by Meteorologist Beau Dodson
First, if you would like to receive these updates via an app, then subscribe to www.weathertalk.com and then download my app (it is in the app store under Beau Dodson Weather – links below).
Want to receive more weather information? I provide a service through www.weathertalk.com
Subscribe at www.weathertalk.com and then download the Beau Dodson Weather app from the app stores!
Apple users: Beau Dodson Weather App
https://wtalk.co/9EZYG8A8
Android users: Beau Dodson Weather App
https://wtalk.co/ZEWYU8ME
Need help? Email me at beaudodson@usawx.com
* Daily weather forecasts
* My personal weather blog with all sorts of weather information!
* Special weather statements sent to the Beau Dodson Weather app.
* Rapid fire tornado alerts.
* Severe weather alerts and forecasts.
* Severe weather updates throughout the day (when severe weather is occurring)
* Ice storm alerts and forecasts.
* Winter storm alerts and forecasts.
* Winter storm updates throughout the event.
* Regional weather videos.
* Long range weather videos.
* A daily forecast that I hand type for your county. Sent out every afternoon.
* Long range outlooks. Including week one, two, three, four, and monthly outlooks. Seasonal outlooks.
* App messages to alert you when I have updated the weather blogs and Facebook.
* And more!
FORECAST ANALYSIS
Good day, everyone. I hope you are enjoying the first week of 2024! I have to get used to typing that four!
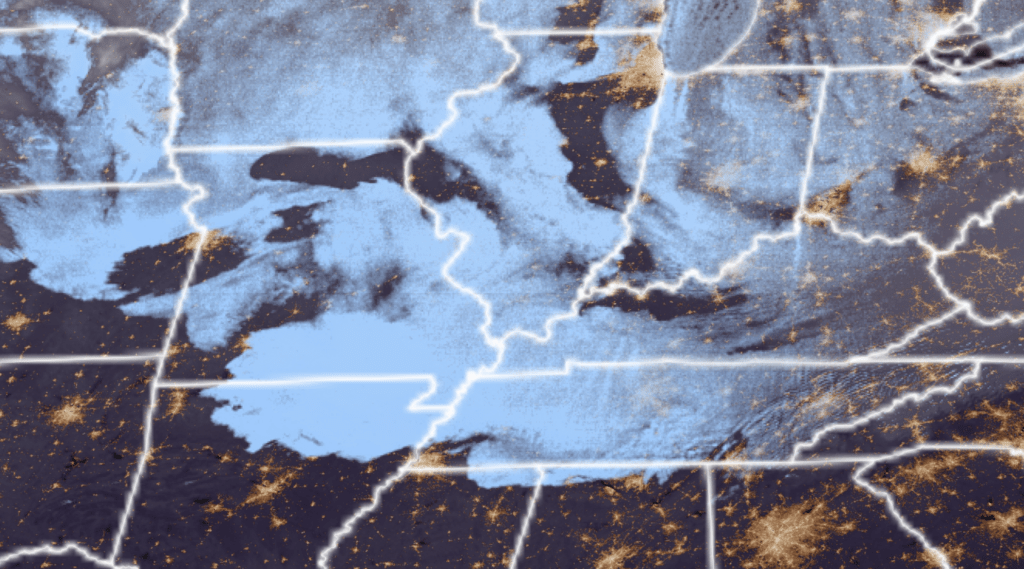
It has been a cloudy week across most of the region. We have not been able to shake the clouds. That happens during the autumn and winter months.
This morning’s satellite shows quite a bit of cloud cover our region.
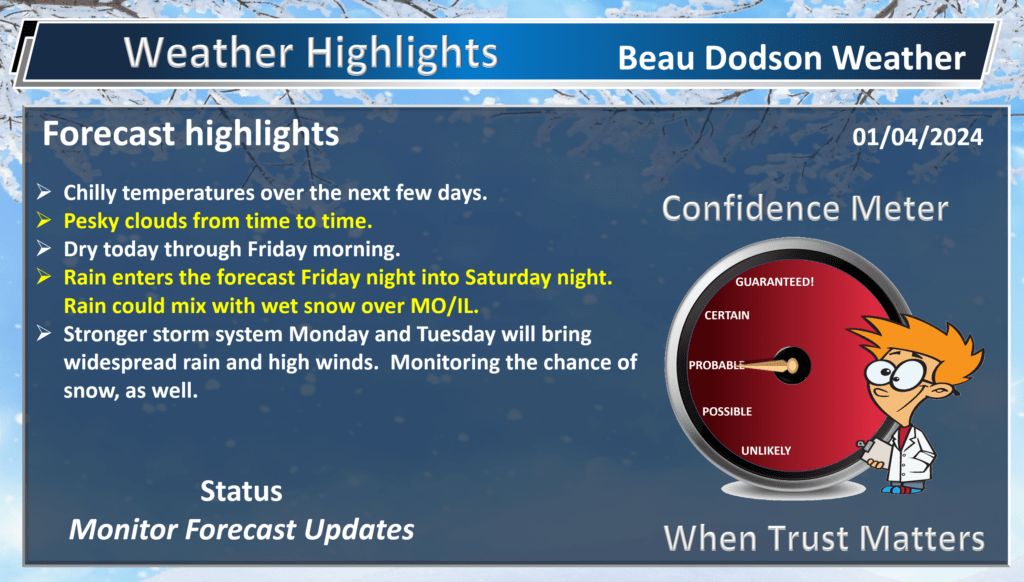
Today and tonight.
We will have intervals of clouds today and tonight. Thickening clouds Friday. That leads to scattered showers late Friday afternoon moving in from Arkansas.
Friday night into Sunday
Rain showers will increase Friday night and end Saturday morning. This is not going to be a drought breaker! Rainfall totals of 0.01 to 0.25″ will be the forecast.
I can’t rule out some wet snowflakes Friday night. Mainly over southeast Missouri and southern Illinois. I know there are some maps floating around showing accumulating snow in western Kentucky, as well. I just don’t see a path for that happening.
Future-cast radar from the NAM model. Green is rain. Blue is snow. Although rain probabilities will be high Friday night and Saturday morning, the totals will be light. Scattered showers.
That system will be followed by a fast-moving weak system Saturday night and Sunday morning. That could produce some additional light rain or rain/snow showers.
Friday and Saturday rainfall totals.
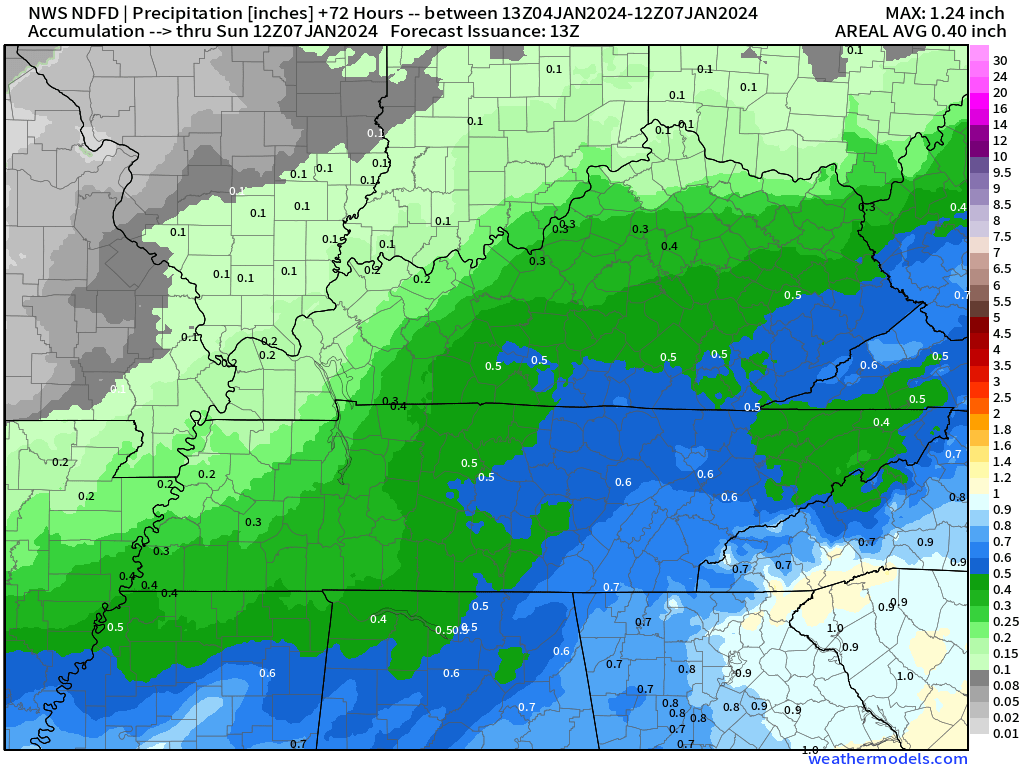
Here is the latest WPC/NOAA rainfall forecast for system one. Friday night and Saturday. Again, not much. We need inches and inches of rain to break our drought.
Drought update.
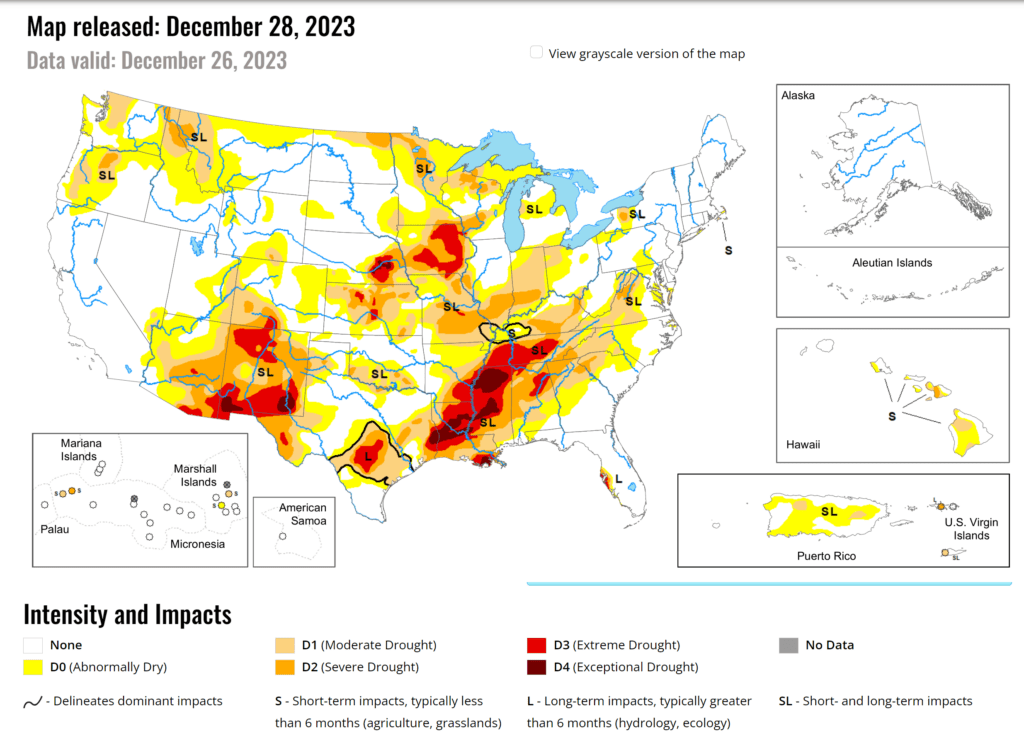
Speaking of drought. This was last weeks. Drought continues to expand.
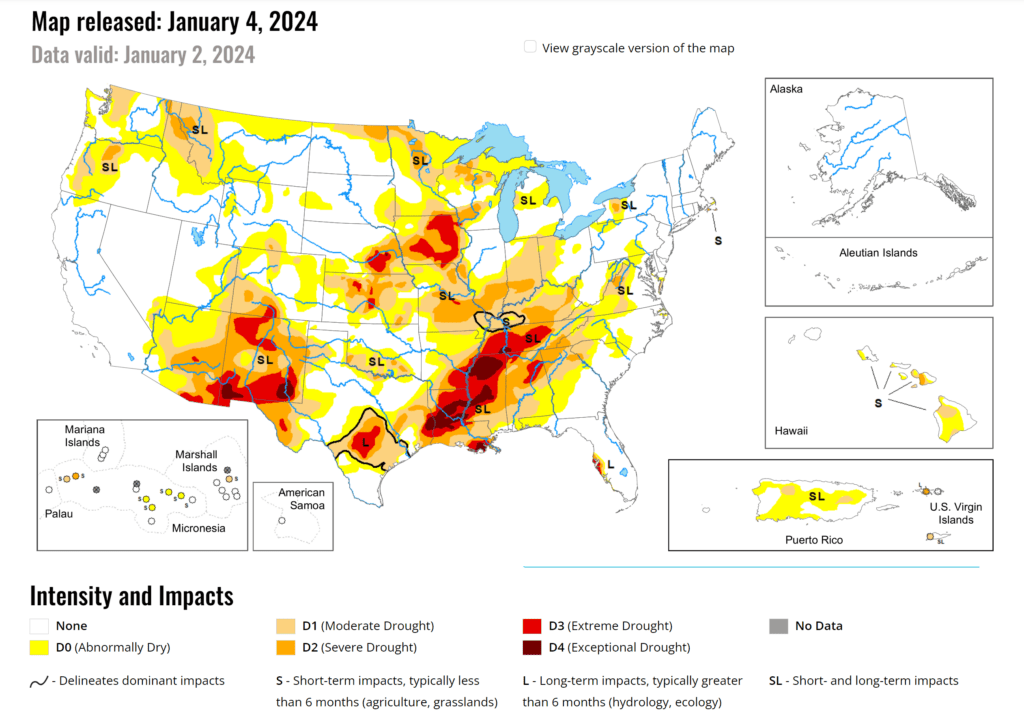
Here is the updated drought monitor map. Moderate drought has expanded across Kentucky.
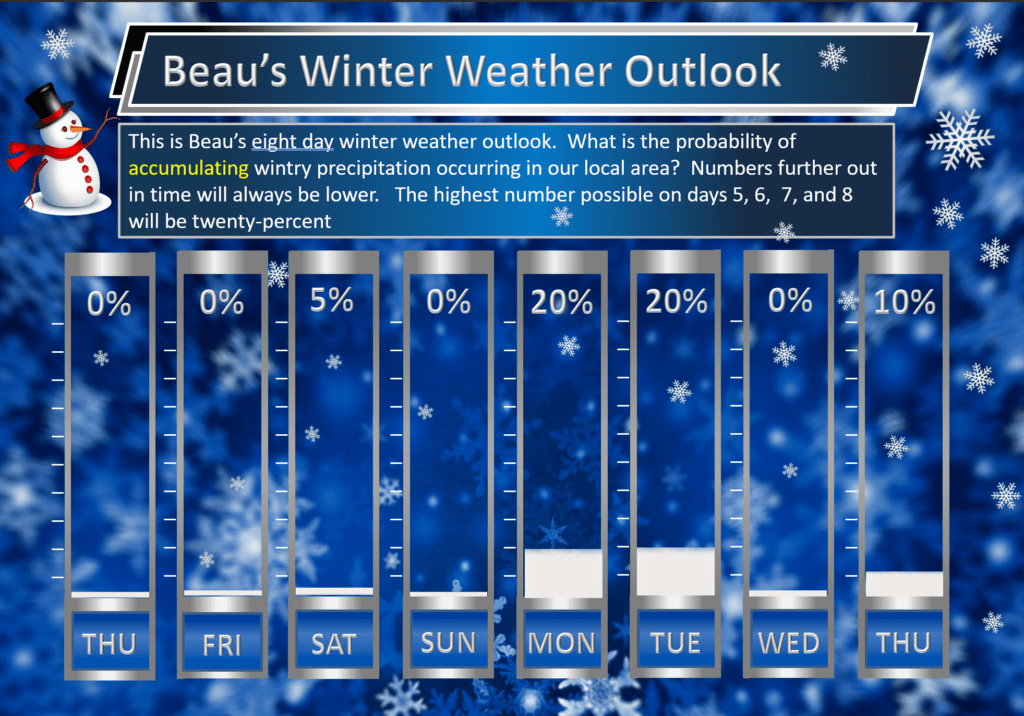
Sunday into Tuesday Forecast
WINTER STORM TO IMPACT MISSOURI AND OHIO VALLEYS
Clouds will linger Sunday and thicken Sunday night. Gusty winds will begin to develop Sunday and Monday, as well. That will occur ahead of our next storm system.
A strong winter storm will impact the central United States next week.
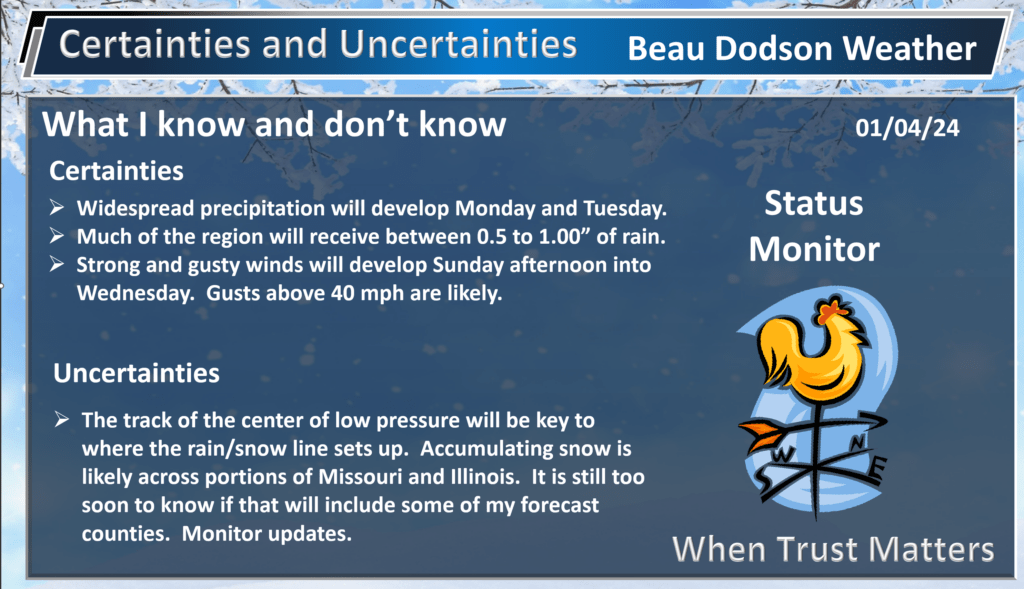
This system is going to cause forecast headaches for meteorologists. As always, storm track is key to our sensible weather. Where the low-pressure center tracks is key to who ends up with rain and who ends up with snow (or both).
At this time, if you live in the Missouri Bootheel into Kentucky and Tennessee, then the odds are that this is going to be a rain event. Perhaps ending as a brief period of wintry precipitation.
If you live in northern portions of southeast Missouri, then you will want to monitor this event. The same goes for southern Illinois.
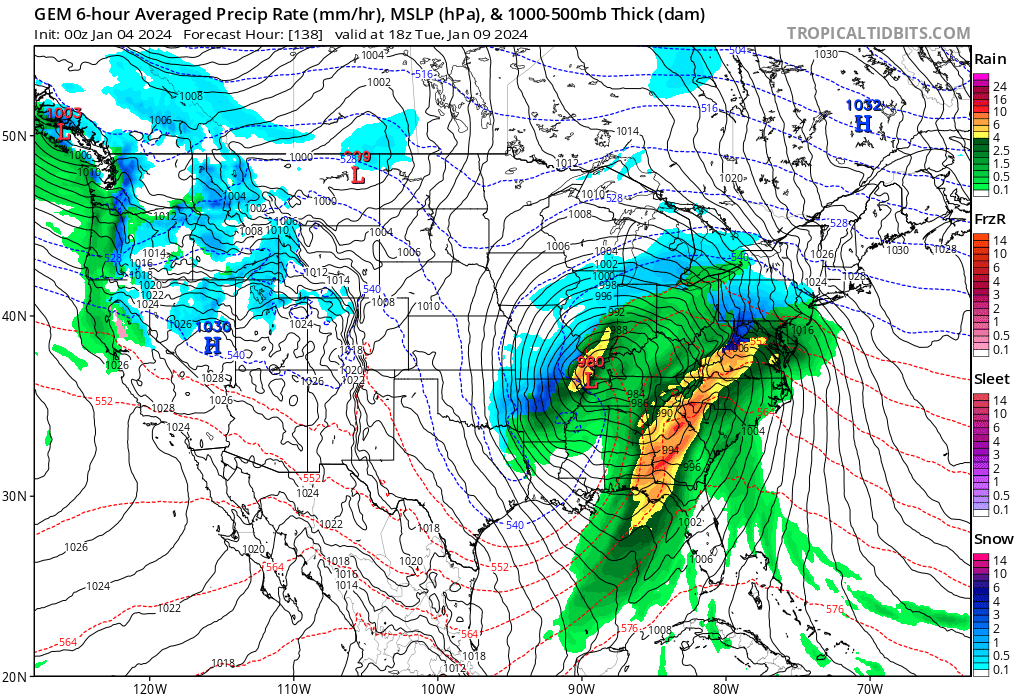
A deep area of low pressure will push out of Texas and Oklahoma Monday. It will move northeast. It will rapidly deepen over our local area.
This will pull moisture northward from the Gulf of Mexico. You can see that on this map. This map shows you PWAT values. PWAT is a measure of moisture. You can see the low tracking through Arkansas into our region. Those black lines are isobars. Equal lines of barometric pressure (some of you have a barometer on your wall).
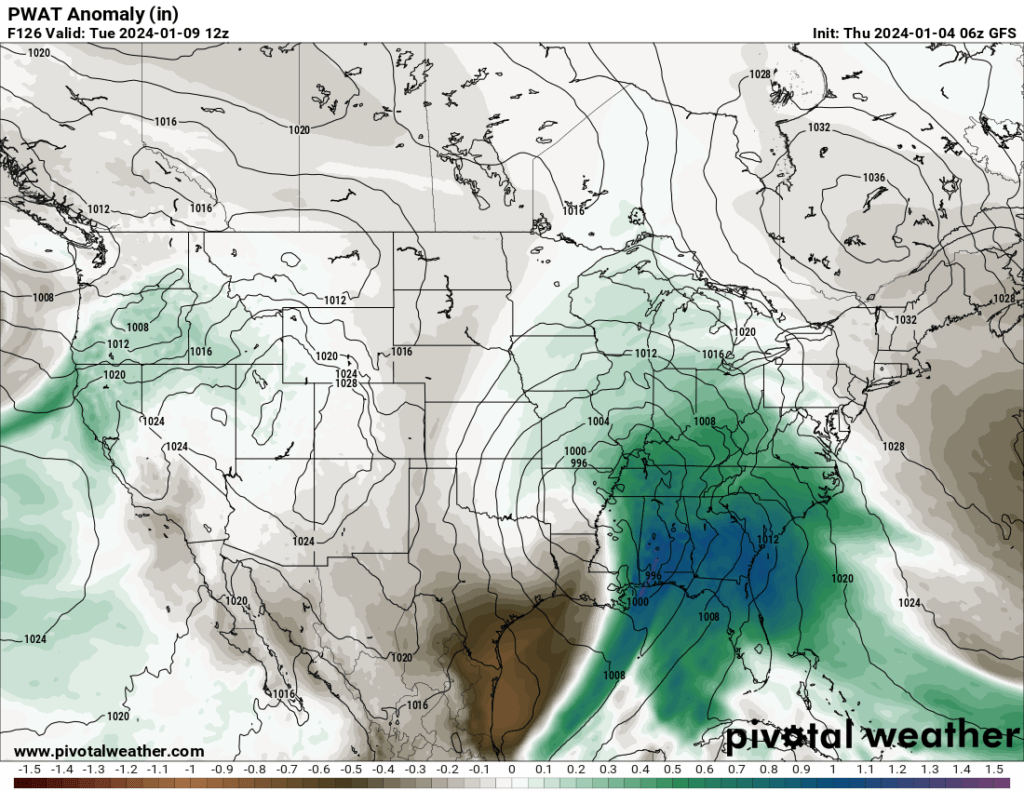
Remember, low pressure rotates counterclockwise. That means warm air is pulled northward ahead of the low. Cold air is pulled southward behind the low.
Here are some examples for you.
Snow typically occurs ahead of the warm front and then west northwest of the low. Severe storms often occur south of the warm front in what we call the warm sector. Where warm air is located.
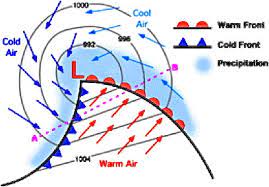
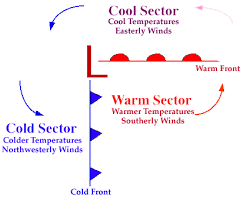
Thus, the farther south and east the low tracks, the higher the probability of snow in your county. If the low moves overhead or to your north northwest, then you are on the warmer side of the system. Often times, that will mean rain. It can mean snow changing to rain (depending on the air-mass).
If the low is to your southeast, then your chances of snow increase.
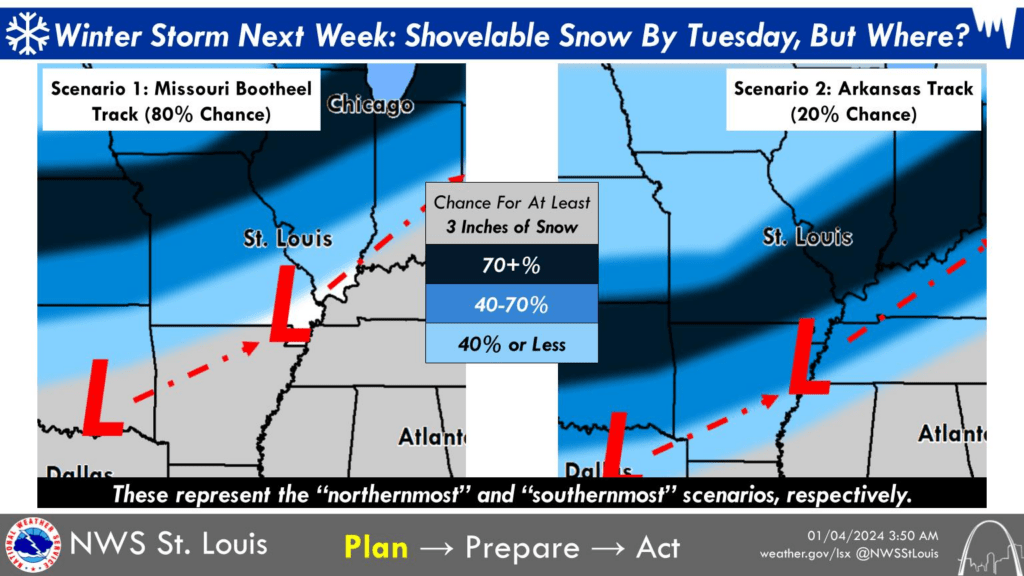
Here is a nice graphic produced by the St Louis, Missouri, National Weather Service. It shows that idea. As you can see, where the low-pressure center tracks makes all the difference when it comes to snow accumulation.
A shift of 50 to 100 miles, in the track of the center of low pressure, completely changes the forecast. This is why winter storm forecasting is so difficult. Small shifts have significant implications.
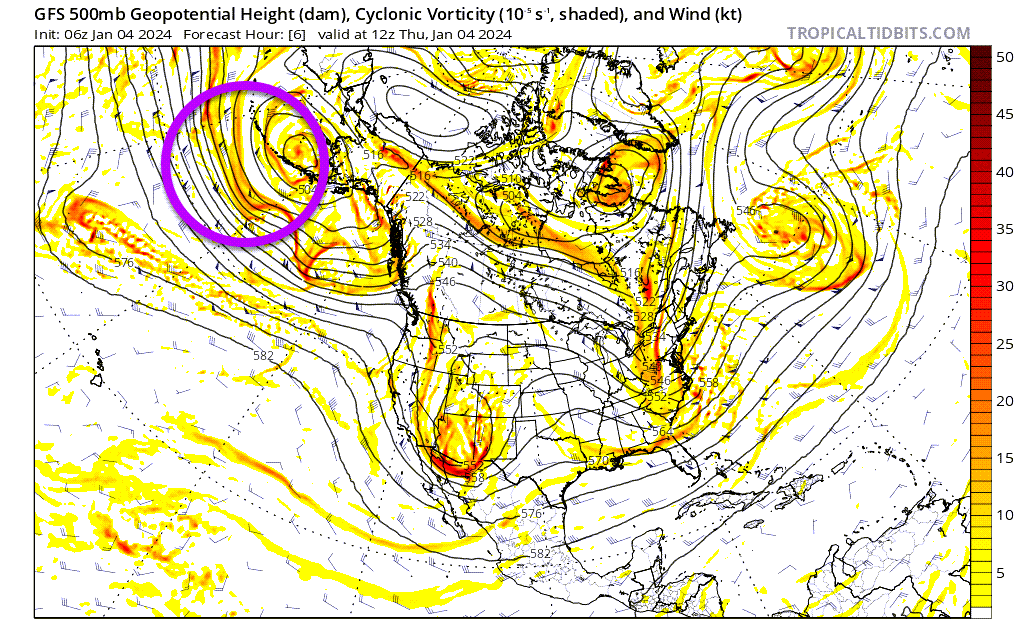
This system in question is still out over the Pacific Ocean! Models don’t “sample” the atmosphere all that well (although it is better than it was years ago) when a system is out over the ocean. Once it moves ashore, then models will have a better sampling.
A better sampling will increase confidence in the forecast outcome. I circled the storm system that we are monitoring. That will eventually become our winter storm.
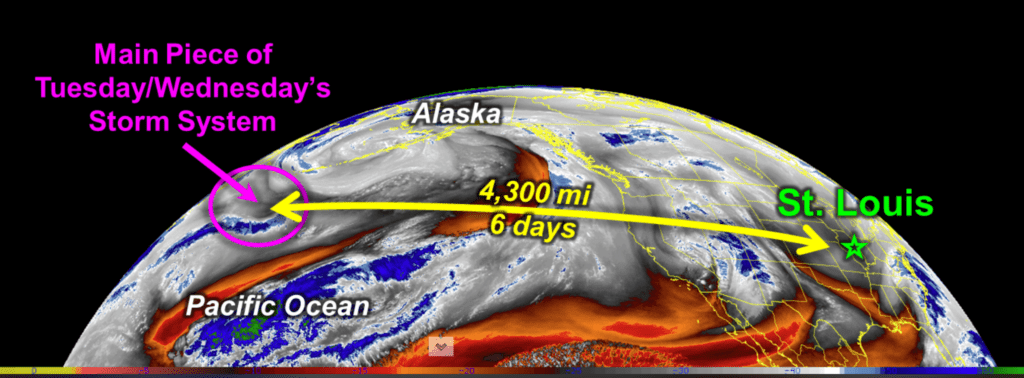
We have been watching this system for the past month.
The St Louis, Missouri, NWS posted this graphic. We are now five days away from the event.
Model ensemble guidance is currently showing the center of low pressure passing over our local area. That would mean rain for most of the region. It could mean snow for our northwest counties.
Keep in mind, if the low shifts south and east in future model runs, then we will pull that rain/snow line farther southeast. This system is still FIVE days away. A lot can change between now and then.
There are limits in forecasting. Sometimes, we just don’t know the outcome. Especially in the long range. Anyone who tells you exactly what will happen five days out is simply throwing darts and guessing.
This is why I tell you to ignore social media snow maps days and days in advance of a system. They can’t be trusted, and they are not accurate.
I always tell you that an accurate snow forecast is typically made 24 to 48 hours in advance of the system. Before then, we can give you a broad forecast idea. We then fine-tune it with each passing 12-hour period.
Let’s look at some ensemble data.
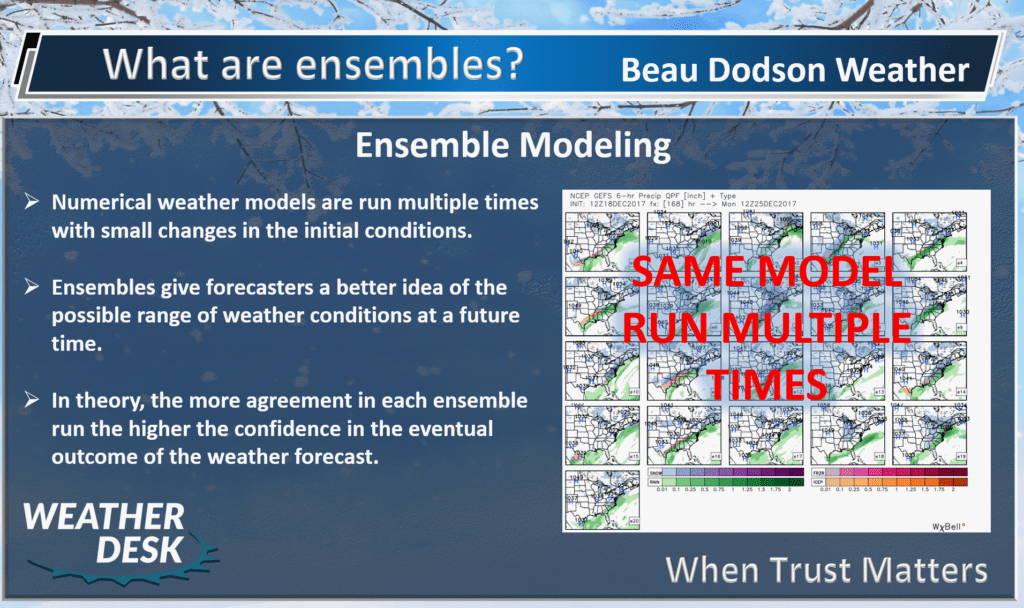
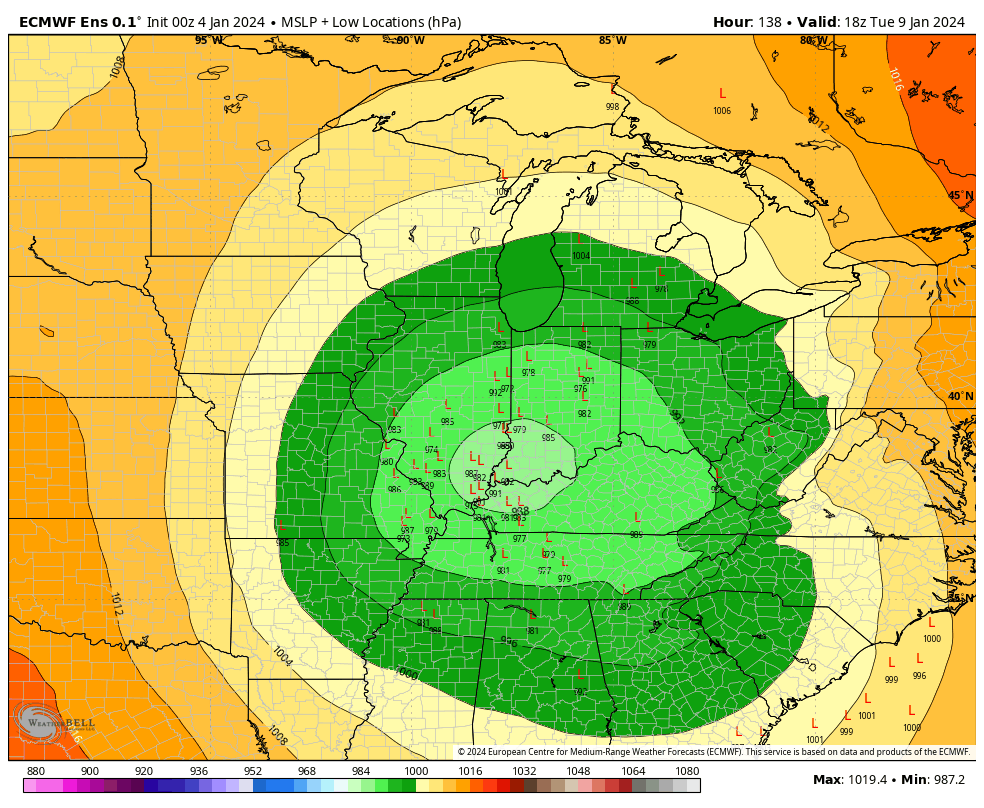
Here is the EC model map. This is the ensemble map.
It shows you where the center of low pressure will likely track. Each L represents the area of low pressure and one model run. The ensembles produce 50+ model runs. The general idea is that the more L’s that align with the other L’s, the higher the chance of that verifying.
For a high confidence forecast you want to see a tight clustering of L’s.
There is decent agreement that the low-pressure center will pass over our area. There are some outliers that are farther south and east and some farther north.
Here is the GFS ensembles. Again, the L represents the area of low pressure. We are looking for tight clustering to increase our confidence in the forecast.
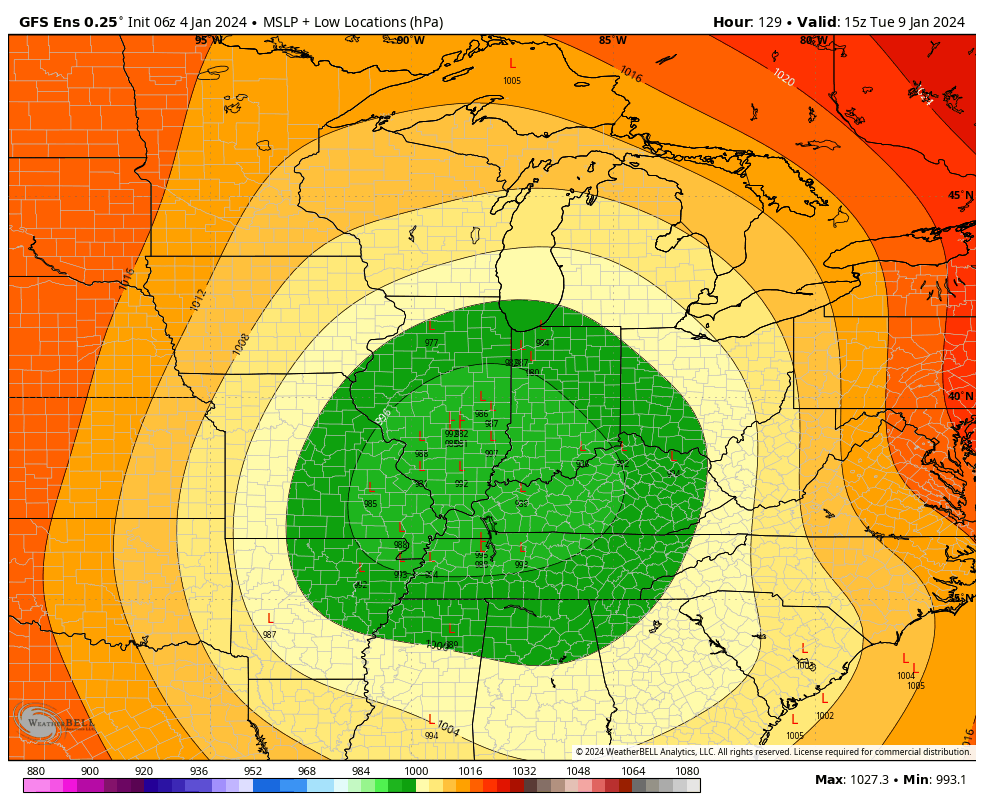
At this time, subject to adjustments, the higher chances for snow accumulation are likely going to be centered from southwest Missouri to central/northern and eastern Missouri into central and northern Illinois. North and west of there, as well.
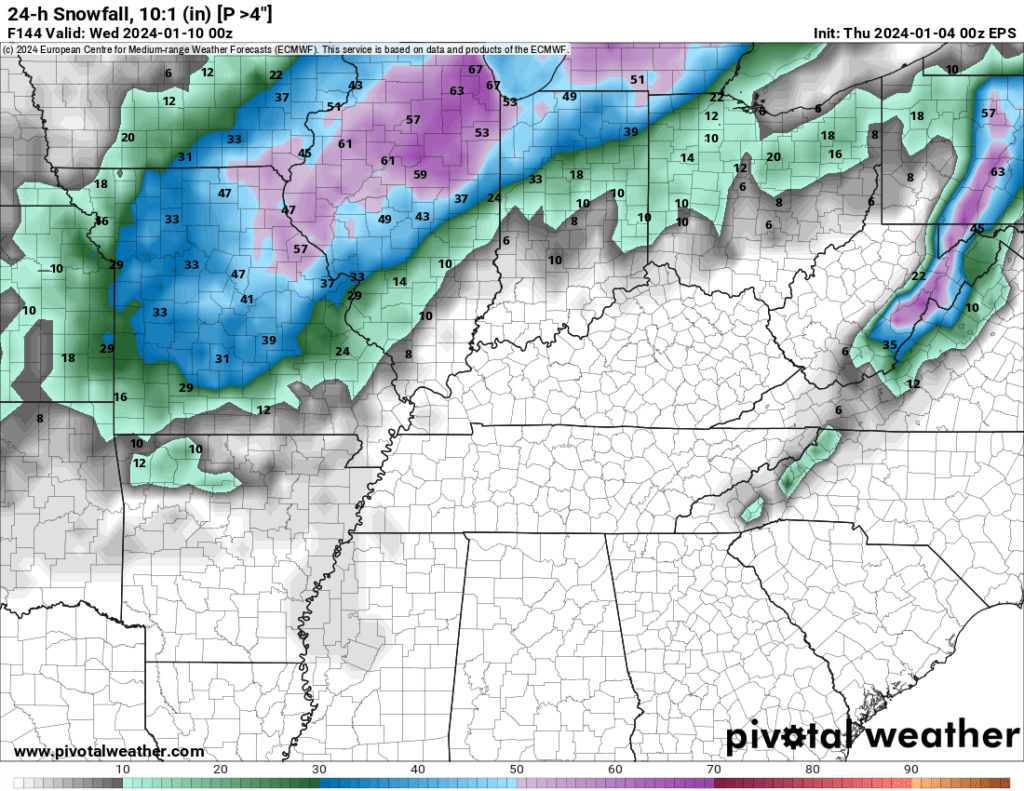
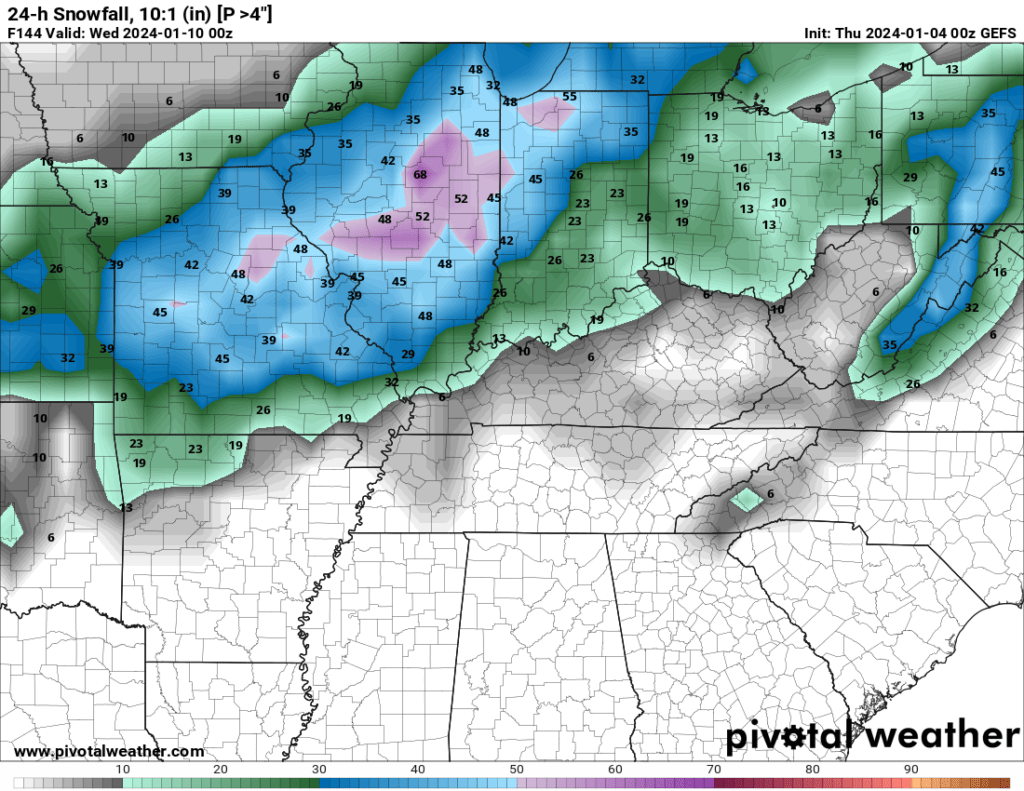
Let me show you the model trends from the GFS when it comes to snow totals. You are looking at the past ten runs of the GFS model. The GFS model runs four times each day.
The last frame represents this morning’s model run. You can see, over time, there has been a shift south and east. I will be monitoring this over the coming days.
As you can see, the GFS is showing a band of 3 to 6 inches of snow. Perhaps locally higher. This could be a heavy wet snow with marginal surface temperatures. Wind driven snow, as well. That could cause power outages if it ends up being a wet snow.
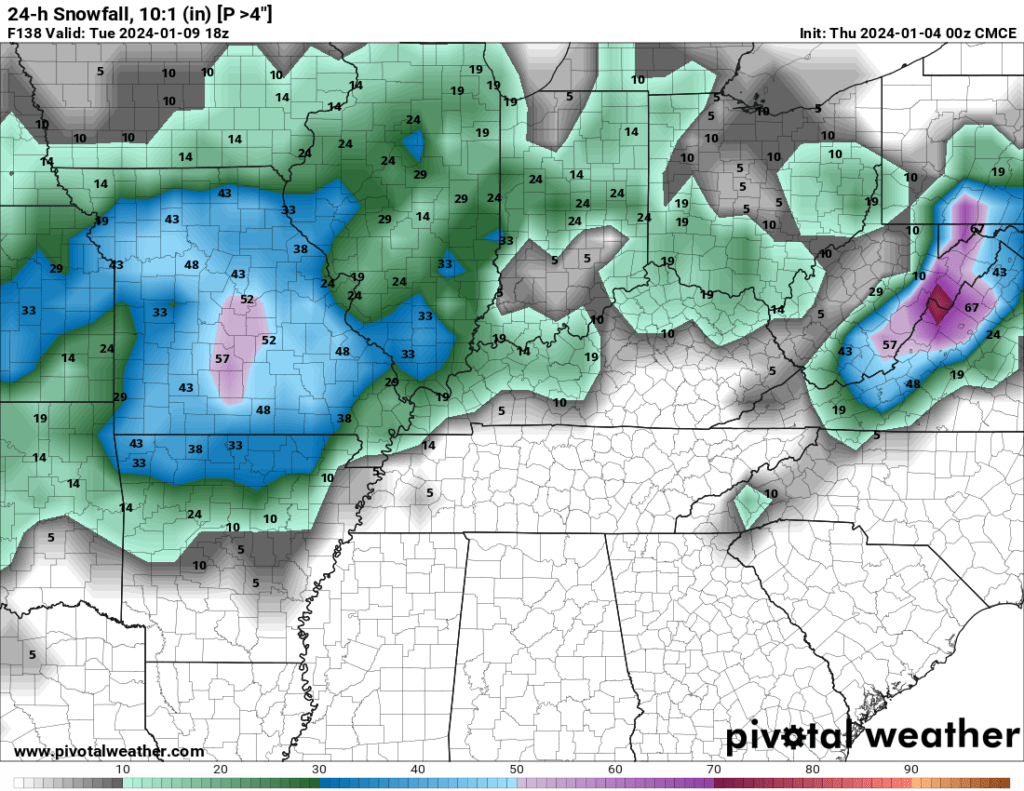
Some more ensemble maps. What is the probability of four or more inches of snow? Let’s keep an eye on these graphics over the coming days. I will be watching for trends.
Three models.
Much of our region will experience rain. Rainfall totals will likely exceed 0.50″. Locally over an inch of rain. Thunderstorms are possible, but the risk of severe weather should stay to our south.
Here is the latest WPC NOAA rainfall outlook. This is the seven-day totals.
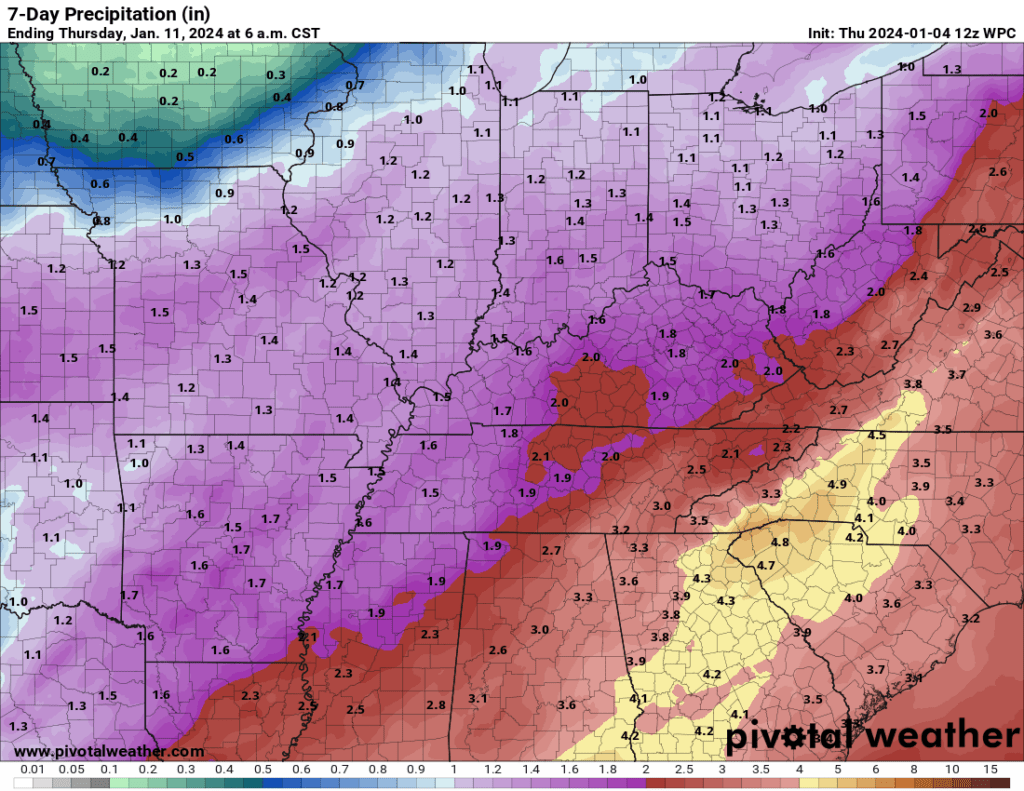
If the low tracks farther northwest, then our chances for intense storms increases. For now, however, we will keep the severe weather to our south. Perhaps a few lightning strikes in Kentucky/Tennessee.
Severe thunderstorms with scattered tornadoes will likely impact portions of Louisiana eastward into Florida.
Another factor in this forecast will be strong and gusty gradient winds. Those will begin to develop Sunday and Sunday night and increase Monday into Tuesday/Tuesday night. The strength of the low will be key to the wind forecast. If we do end up with a 972 to 984 mb low pressure center, then our chances for wind gusts above 40 mph will increase.
That would be near record low pressure for our region. We had a system last March that produced record low pressure. That system delivered widespread 50 to 60 mph wind gusts. This one does not look quite as intense, but still could produce strong winds.
Winds above 40 mph could cause some scattered wind damage and power outages.
The strongest winds will likely develop Tuesday and Tuesday night. Let me show you the GFS wind gust forecast. Depending on the strength of the low, these winds could be higher.
These winds are called gradient winds.
Here is the GFS and EC model wind gust potential maps. The highest wind will likely arrive Tuesday.
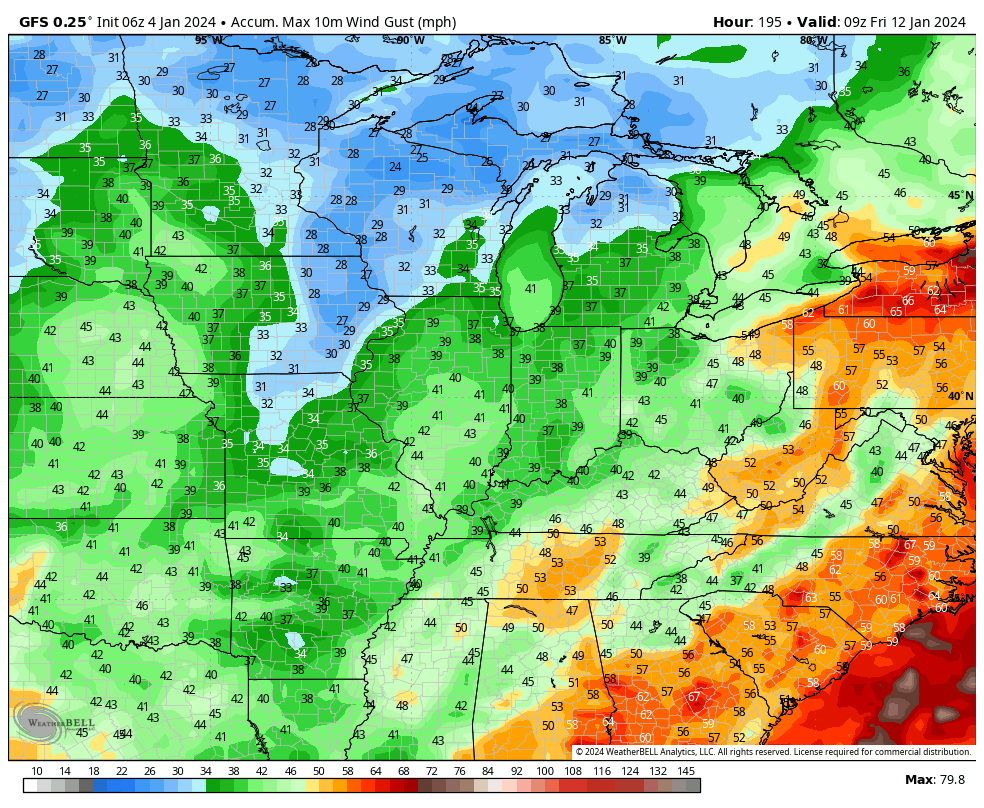
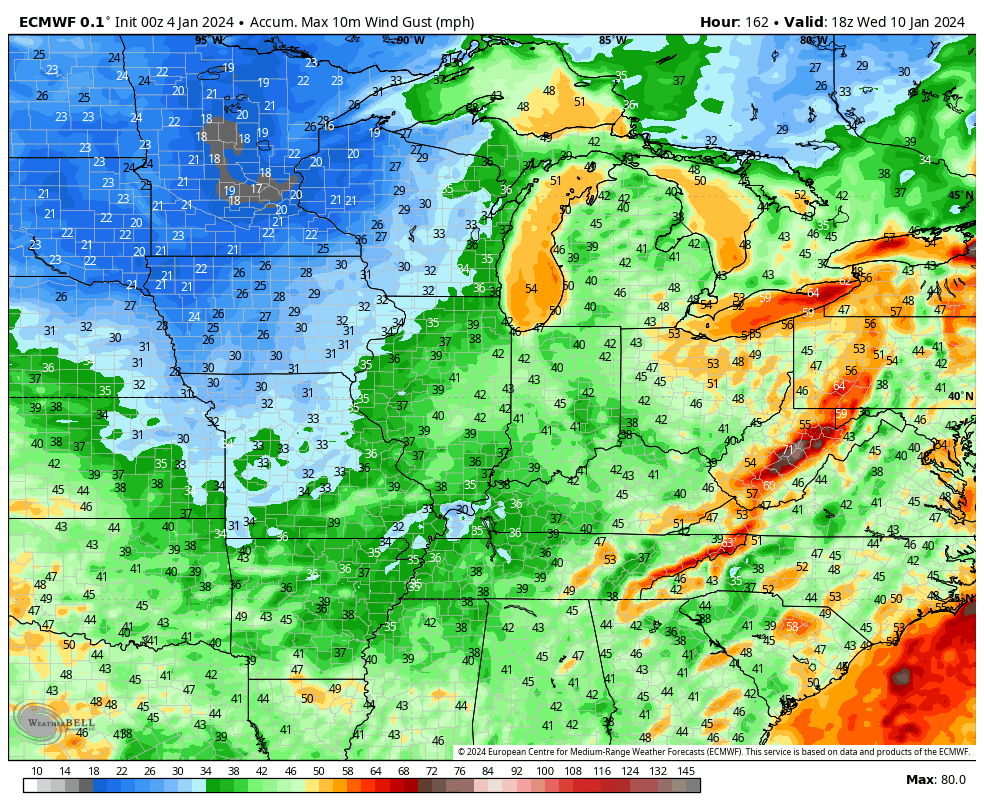
Gradient winds occur when barometric pressure isobars are closely packed together. Rapidly rising and rapidly falling pressure causes strong and gusty winds.
Notice how tightly backed the isobars are with this system.
All those squiggly black lines are isobars. Equals lines of barometric pressure.
A wind advisory may be necessary Monday or Tuesday of next week. Gusty winds will continue into Wednesday.
Monitor Updates
There are a lot of moving parts to the forecast. As I always tell you, don’t walk away with one forecast and assume that will still be the forecast days in advance. These systems evolve.
Let’s look at some WPC/NOAA graphics.
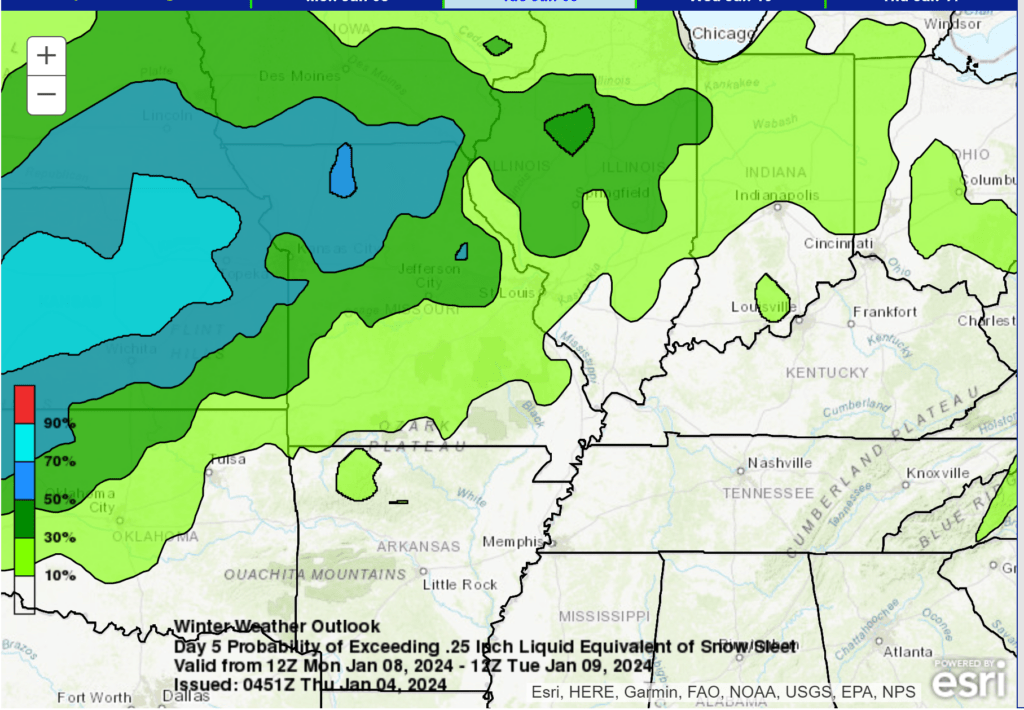
This graphic shows you the probability of 0.25″ of precipitation. That would be melted precipitation that equals 0.25″. For example, 0.25″ usually equals 2 to 3 inches of snow (with a 10:1 ratio).
NOAA has the highest probabilities centered pretty far northwest. I suspect we may see a shift south and east in future updates. Let’s keep an eye on it. This graphic runs from 6 AM Monday to 6 AM Tuesday.
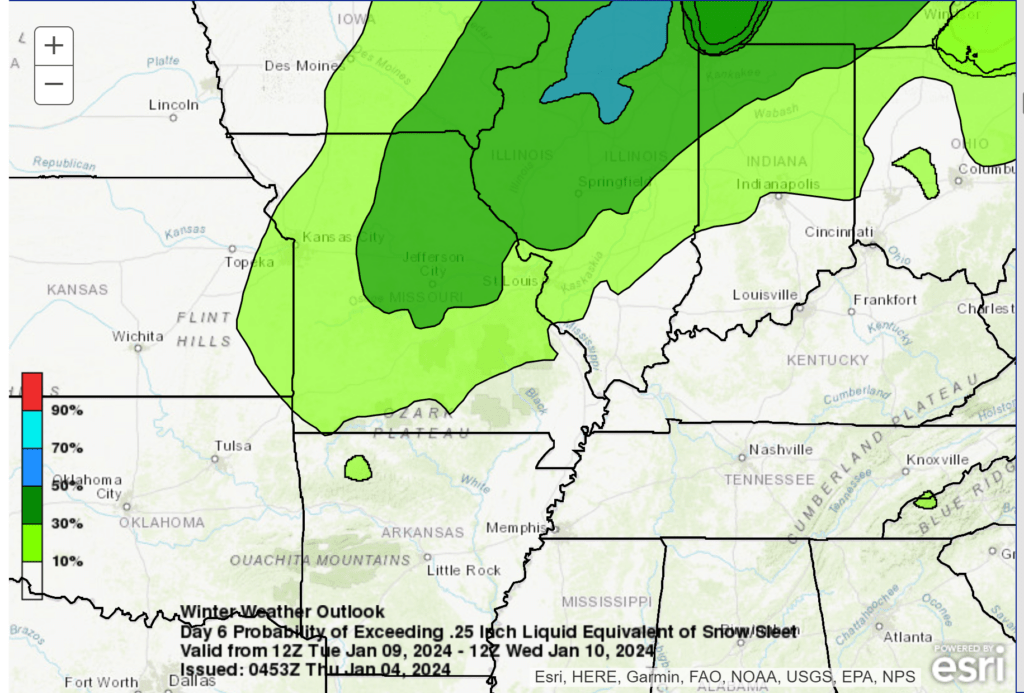
This next map runs from 6 AM Tuesday to 6 AM Wednesday. This lines up fairly well with current model data. Again, this represents the probability of 0.25″ of precipitation (melted).
Keep checking back. I will know a lot more by Saturday. By then the system will enter the high-resolution model timeframe. Confidence will continue to increase in the forecast details with each passing day.
I am watching another system next Wednesday and Thursday and another one next weekend. Active pattern.
Have a great day!